

F8 Studio
F8 Studio is the browser UI for Fallen-8: a React single-page app the API app serves from its own wwwroot, reachable at http://localhost:8080 in the compose environment (build and serving are covered in running.md). It is a workbench over one instance’s REST surface — connect to a server, inspect and mutate a graph, run queries and algorithms, visualize results — and, because Fallen-8 has no query language (delegates.md), it gives humans and code-generating agents a place to author, validate, and refine the C# delegate fragments that queries are made of.
Layout
Section titled “Layout”A fixed icon rail on the left switches screens; a top bar names the active instance (dropdown), the active namespace (dropdown), and the resulting endpoint prefix (baseUrl → /ns/{ns}/*), with a link to these docs plus live-feed and health chips pinned right. Every screen except Connect is locked until the active instance answers GET /status and the credential is authorized. Switching either instance or namespace remounts the current screen, so in-progress results never leak across contexts.
Each screen’s input form and the Canvas contents are remembered per instance-and-namespace: leaving a screen and returning restores exactly what you had entered. Fetched results are re-run on demand rather than persisted. Instance registrations and API keys live only in this browser’s local storage.
Connect, Save games, and Benchmark are Fallen-8-level (they can span namespaces); the rest operate on the active namespace and live under /q/{ns}/….
A low-key Replay intro button is pinned to the bottom of the rail and is always available: it plays the first-run walkthrough (below) on demand.
| Screen | Scope | Purpose |
|---|---|---|
| Connect | Fallen-8 | Register instances, instance configuration (semantic providers + observability), manage namespaces |
| Dashboard | namespace | Status overview: vertex/edge counts, memory |
| Samples | namespace | One-click demo-graph gallery with a capability tag filter |
| Save games | Fallen-8 | Checkpoint registry (load / delete) + administration (save/load/erase, jsonl import/export) |
| Browser | namespace | Look up an element, inspect properties/embeddings, adjacency, bulk view, mutations |
| Query | namespace | Property scans and index queries (equality/range/fulltext/spatial/vector) + the stored-query library |
| Indexes | namespace | Create and manage indexes and their content |
| Path | namespace | Route finding (BLS / Dijkstra) with filters, costs, semantic scoring |
| Subgraph | namespace | Subgraph lifecycle + pattern builder |
| Analytics | namespace | Graph shape + run algorithms with write-back |
| Plugins | namespace | Built-in plugin families + the runtime-authored plugin registry |
| Canvas | namespace | 2D/3D visualization of whatever you send to it |
| Benchmark | Fallen-8 | Optionally generate a random graph, measure edge-traversal throughput on any loaded graph |
First run
Section titled “First run”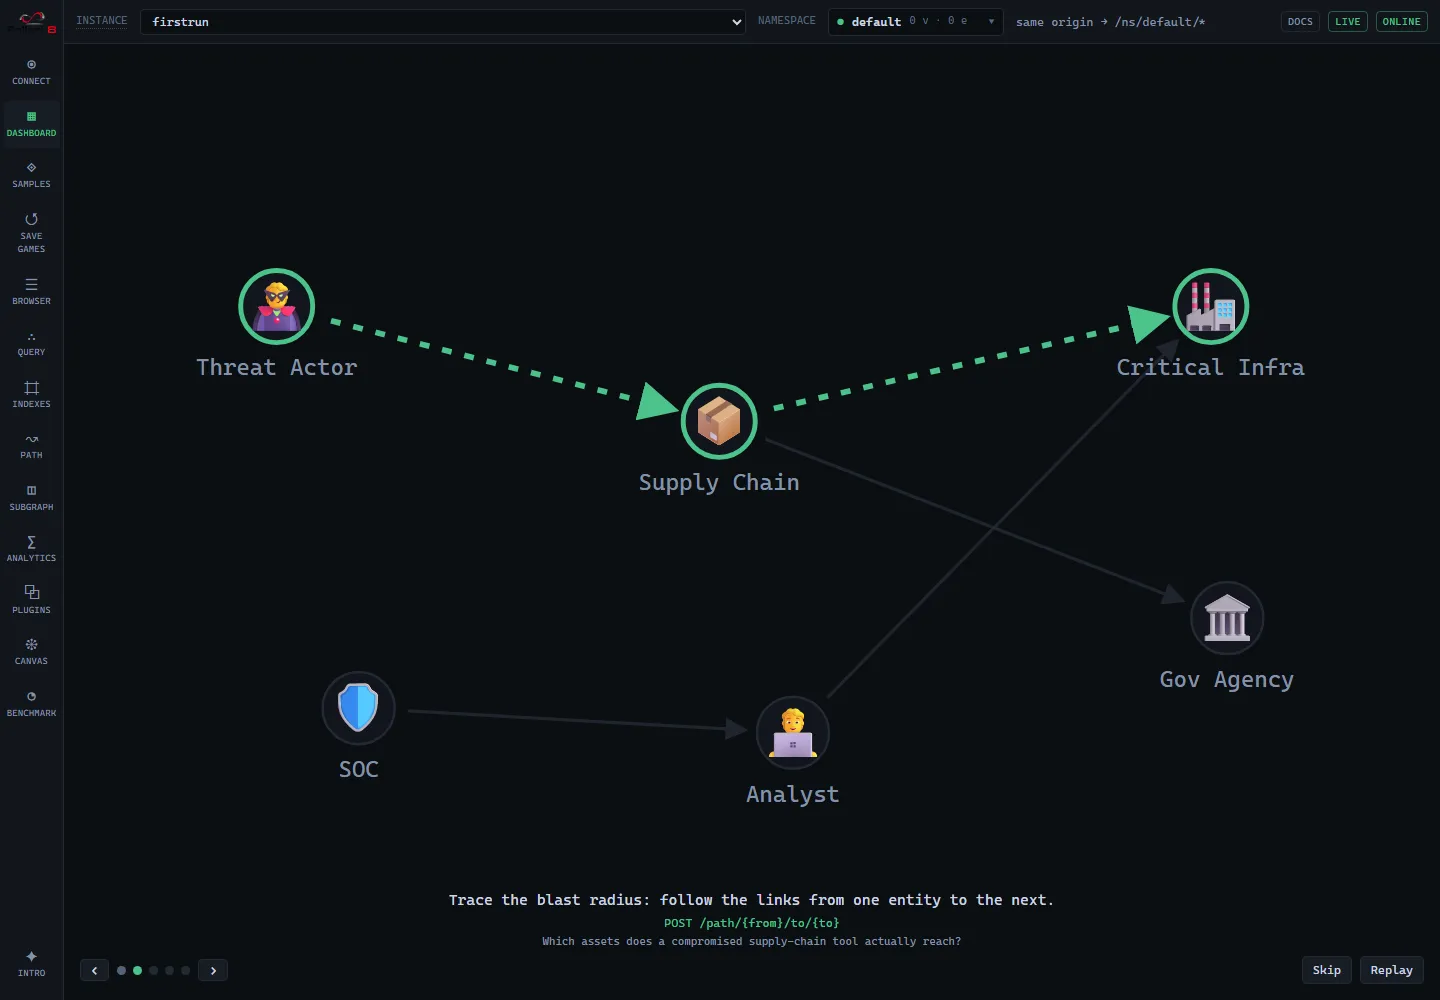
On an empty namespace the Dashboard opens with a short animated walkthrough instead of three zeroed tiles. It plays through five beats on a small built-in mock graph (“Asymmetric Cyber Warfare”: a threat actor, a compromised supply-chain tool, its targets, and the defenders, drawn with emoji nodes and directed arrows), each with one line of caption: a graph is entities and typed relationships; trace the blast radius from one entity to the next (POST /path/{from}/to/{to}); rank what matters with analytics (POST /analytics/PAGERANK); extract a matched pattern as its own recalculable graph (PUT /subgraph); and search by meaning then expand (POST /scan/index/vector). It then rests on a handoff: Browse sample graphs (opens the curated Sample gallery), Import your own data (JSONL to POST /bulk/import), or Explore on my own.
Each beat holds for about ten seconds, and Prev / Next / the step dots (plus the Left/Right arrow keys) let you step through the features at your own pace; a manual step pauses the autoplay. The show is entirely client-side and read-only: it draws the mock as SVG and animates it, and it creates nothing. Only the handoff buttons act, and only on click. It is skippable and replayable, pauses when the tab is hidden, and honours prefers-reduced-motion by rendering the final framed state with no motion. Dismissing it is remembered per namespace, but it reappears if that namespace is genuinely empty again. Replay intro in the rail reopens the same walkthrough at any time, on the mock graph, over whatever screen you are on, without touching your data or the dismissed state. The same graph ships as the Asymmetric Cyber Warfare sample so you can load the real thing in one click.
Connect
Section titled “Connect”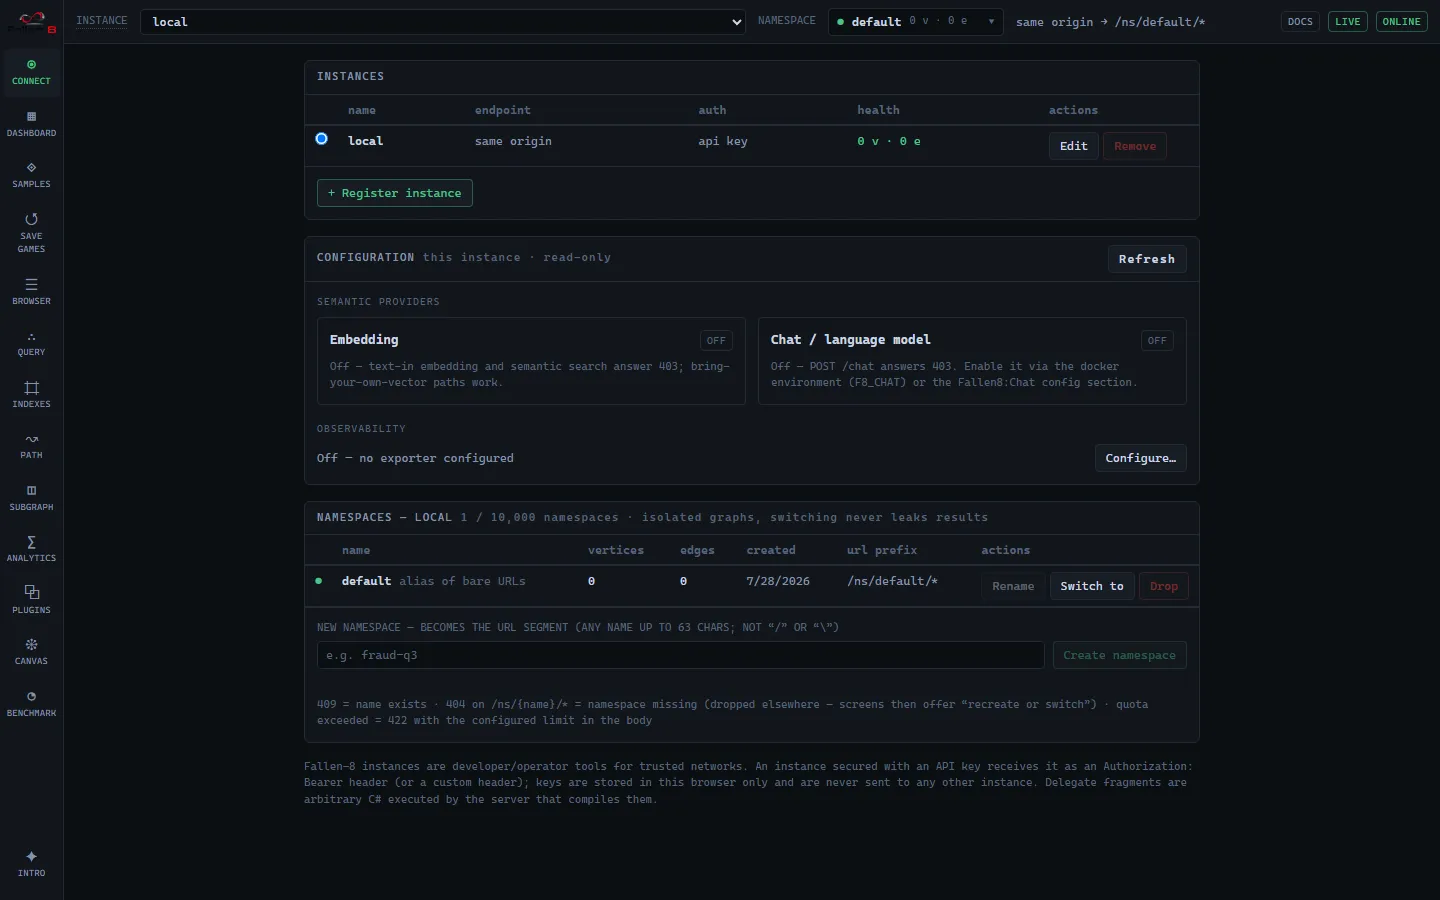
Three panels. The Instances table lists registered servers with a radio to activate one, its endpoint and auth kind, and a live health cell (a lazy GET /status showing vertex/edge counts, or unreachable / unauthorized). “+ Register instance” takes a name, a base URL (empty = same origin as Studio), and an optional API key; keys are stored in this browser only and sent as a bearer/custom header (security.md). The Configuration panel (below) shows the active instance’s instance-wide config read-only. The Namespaces panel manages the active instance’s namespaces — create, rename, switch to, drop, with counts and the /ns/{name}/* URL prefix; default aliases the bare routes and cannot be renamed or dropped (namespaces.md).
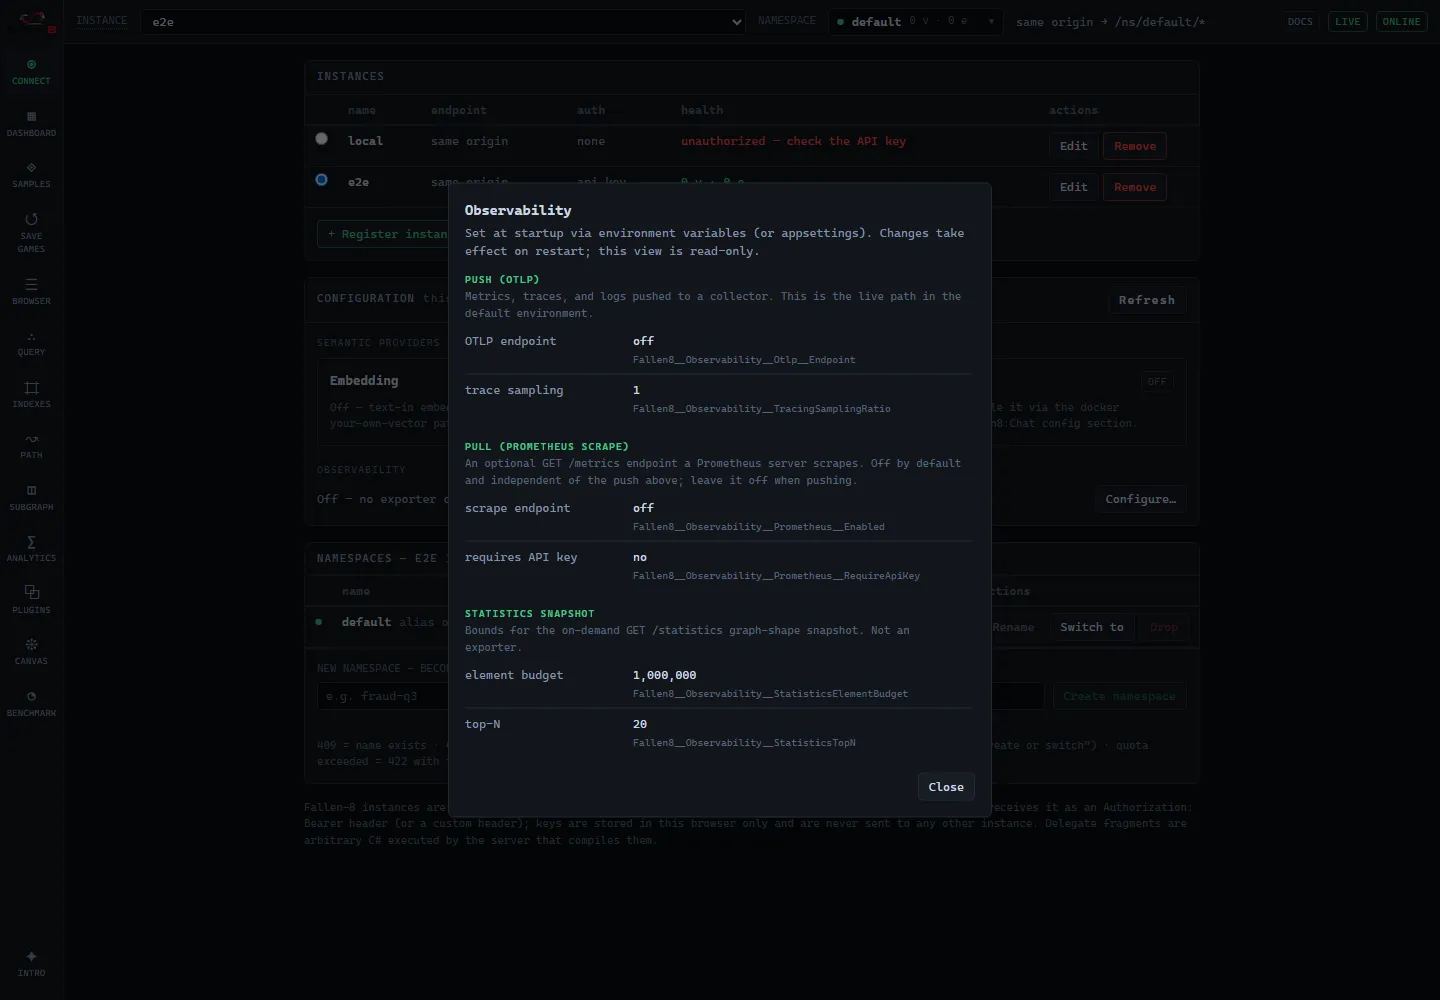
The Configuration panel is read-only (instance config is set at startup via env/appsettings, so it is display + guidance, not an editor). It sourced from GET /config and shows: the semantic providers — the embedding provider (backend / model / dimension / metric / loaded) and the chat gateway (backend / model / loaded, plus GPU when the Ollama backend reports VRAM residency); and the observability posture — a one-line status (“pushing metrics + traces + logs to <endpoint>” / “Prometheus at /metrics” / off) with a Configure… overlay that groups every value under Push (OTLP), Pull (Prometheus scrape), and Statistics snapshot (so the live push path is never mistaken for the off-by-default scrape endpoint), each row showing its Fallen8__… env key. Secrets are never shown (only whether an API key is required). See semantic-traversal.md and observability.md.
Dashboard
Section titled “Dashboard”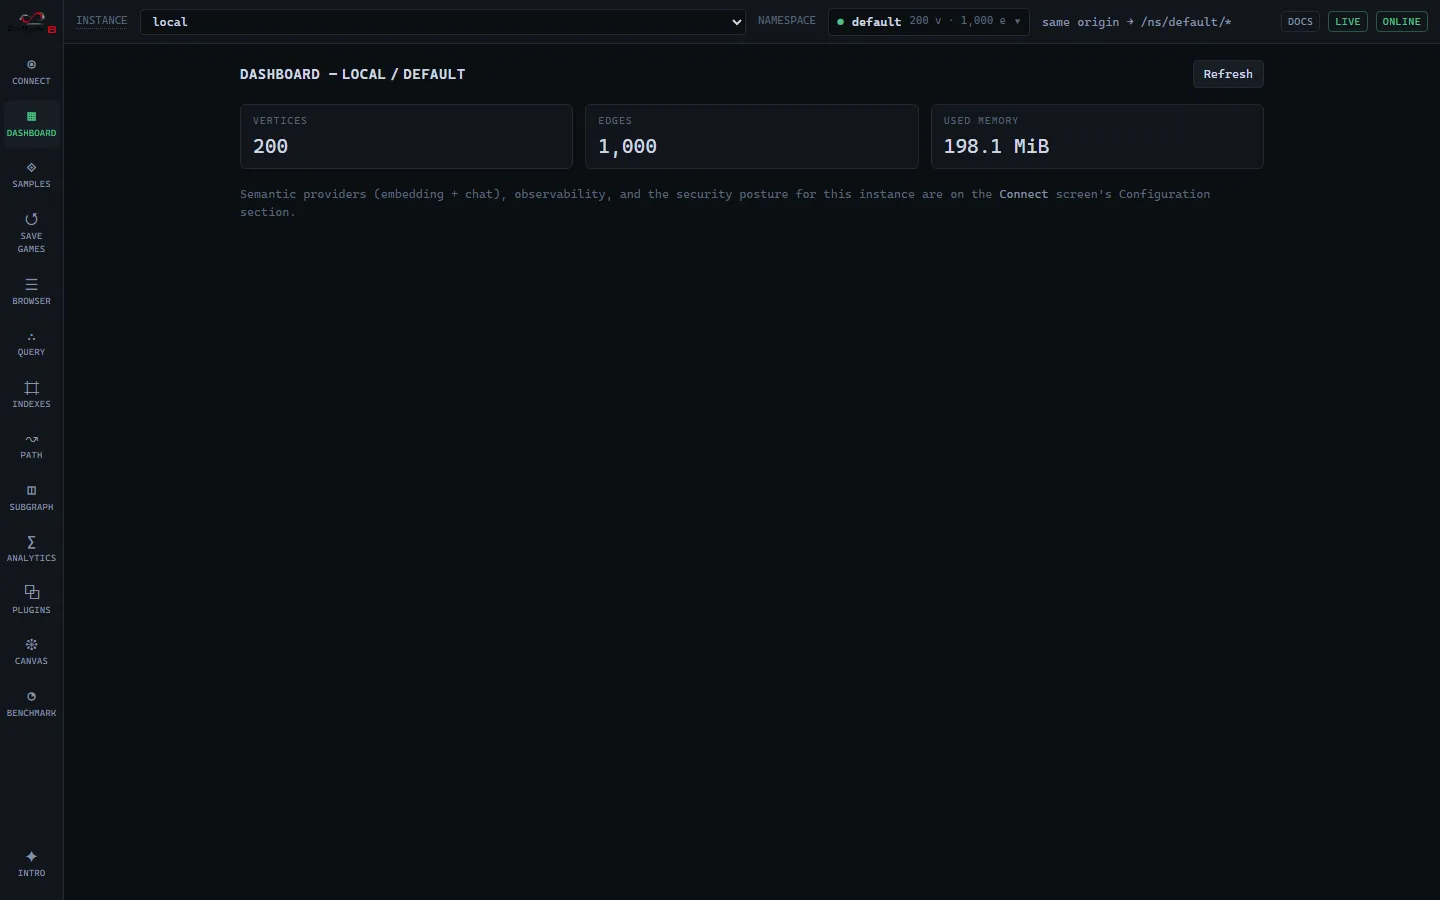
A lean status overview for the active namespace: vertex/edge counts and used memory from GET /status (observability.md). On an empty namespace it opens with the first-run walkthrough (above) instead of zeroed tiles. Everything that used to crowd the Dashboard now has its own home — the sample gallery is Samples, the plugin inventories and registry are Plugins, persistence and administration are Save games, stored queries are managed per scenario on Path and Subgraph, and the semantic providers + observability moved to the Connect Configuration section.
Samples
Section titled “Samples”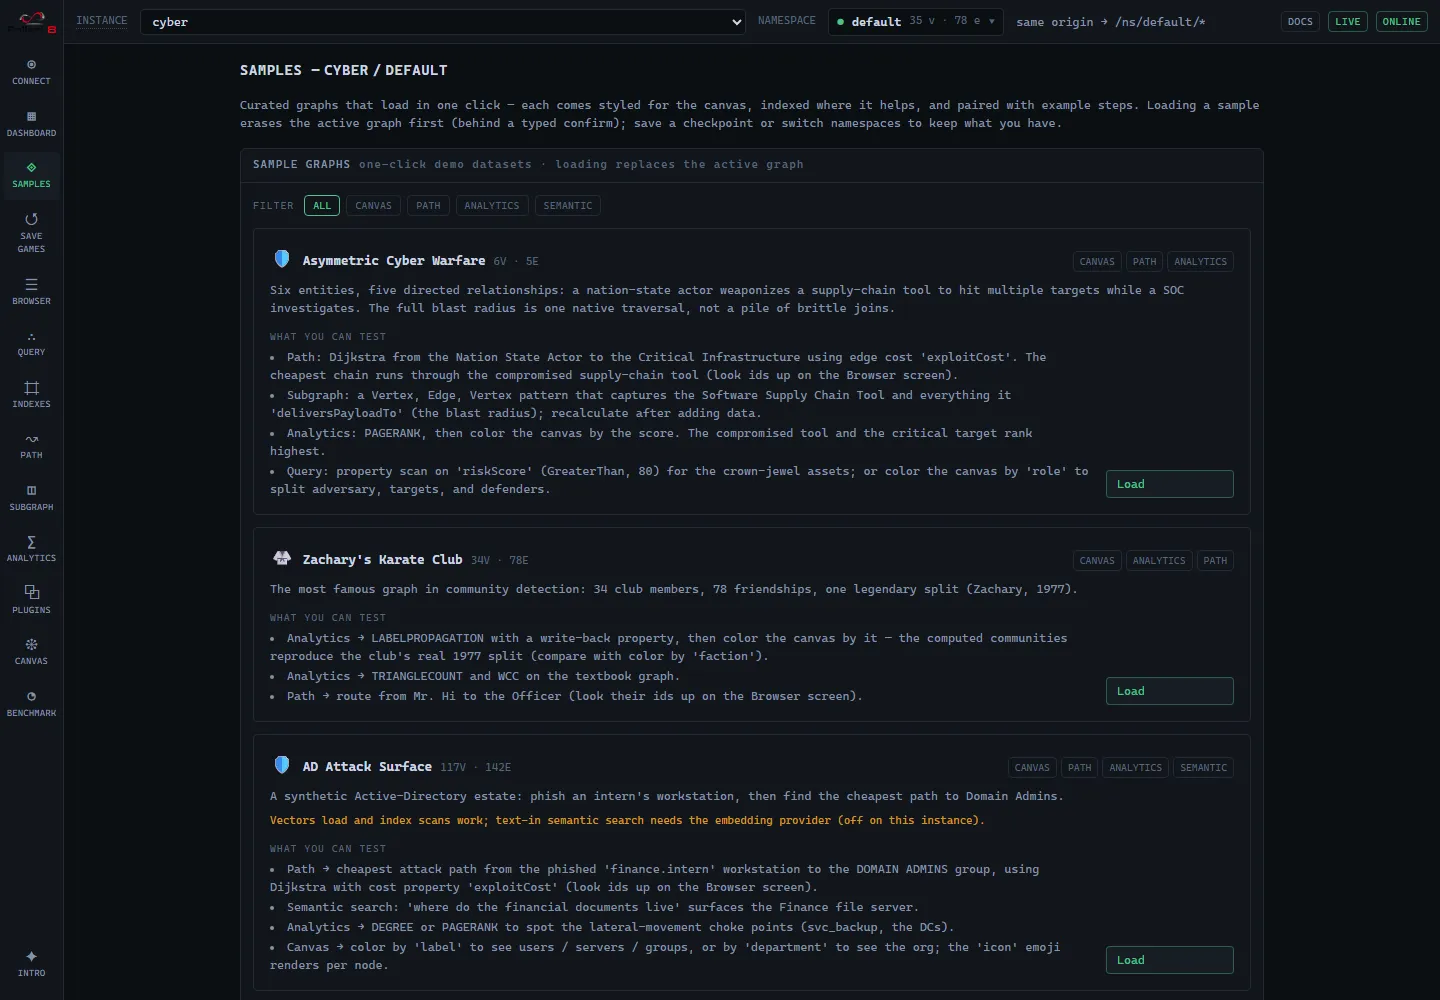
The one-click demo-graph gallery. Each full-width card names a curated dataset, its vertex/edge counts, its capability badges, and a what you can test list; Load fetches the dataset, imports it, builds its indices, and drops it onto the canvas with the sample’s style. A tag bar at the top filters the gallery by capability (canvas / path / analytics / semantic / spatial). A live Any GitHub repo card ingests any public repository’s dependency graph just-in-time, and a Scale card points at the Benchmark tab’s server-side generator. Loading into a non-empty graph erases it first behind a typed confirm — save a checkpoint or switch namespaces to keep the current data. Walkthrough with queries: samples.md.
Browser
Section titled “Browser”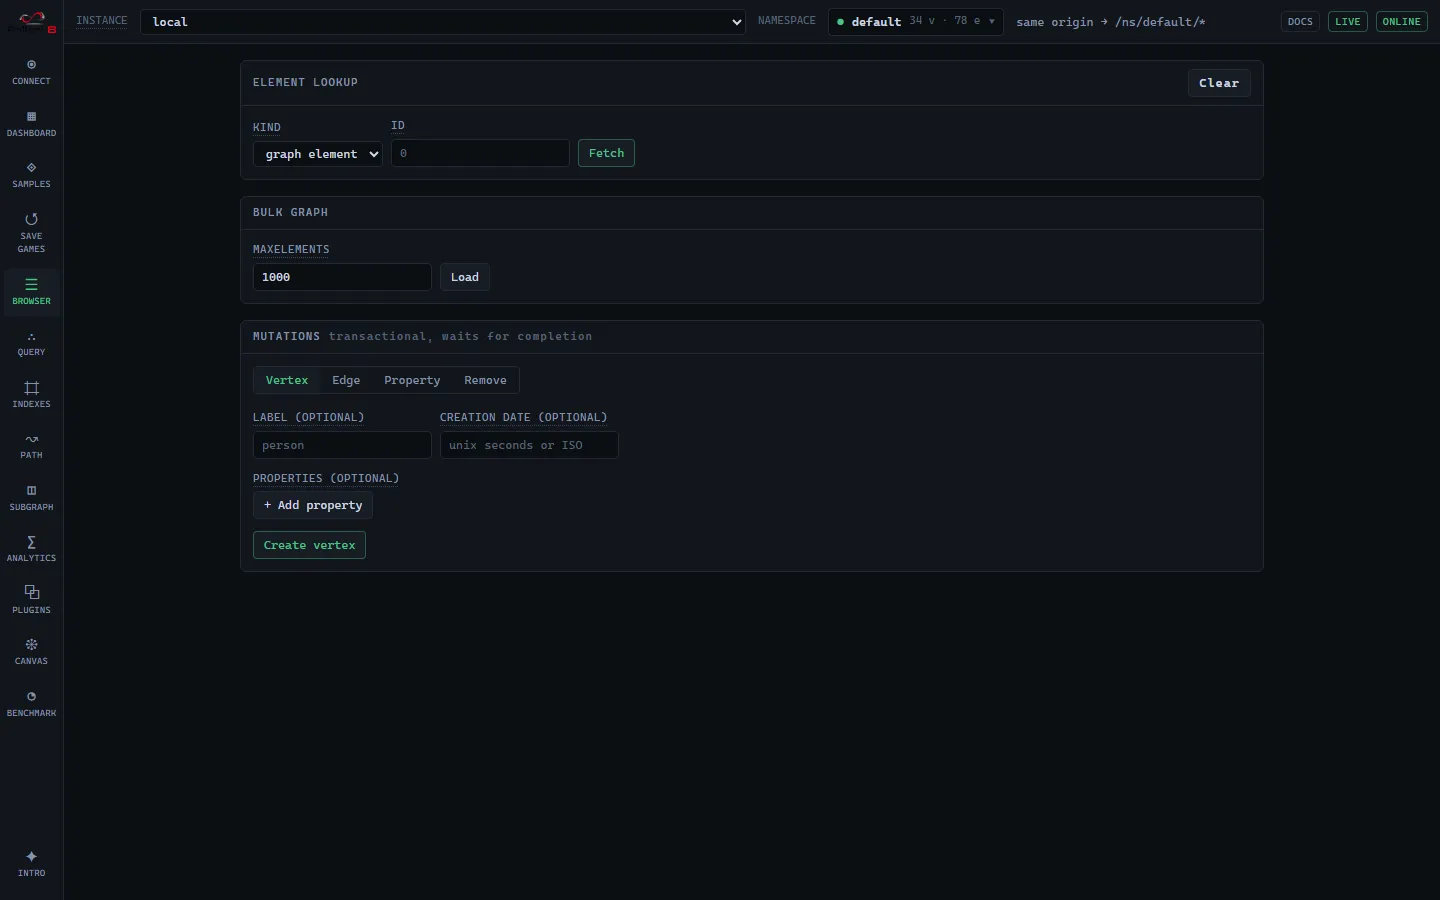
Look up a graph element, vertex, or edge by id. The inspector shows the label, timestamps, edge endpoints, and two tabs: Properties, and Embeddings — set, replace, or remove a named embedding on the element from a pasted vector or (with the provider) from text (semantic-traversal.md). An adjacency panel lists neighbors with degrees for one-click hopping, and a bulk view loads up to maxElements with a truncation badge and a filter. A mutations panel creates and edits vertices, edges, and properties (graph-model.md). “Send to canvas” is available throughout.
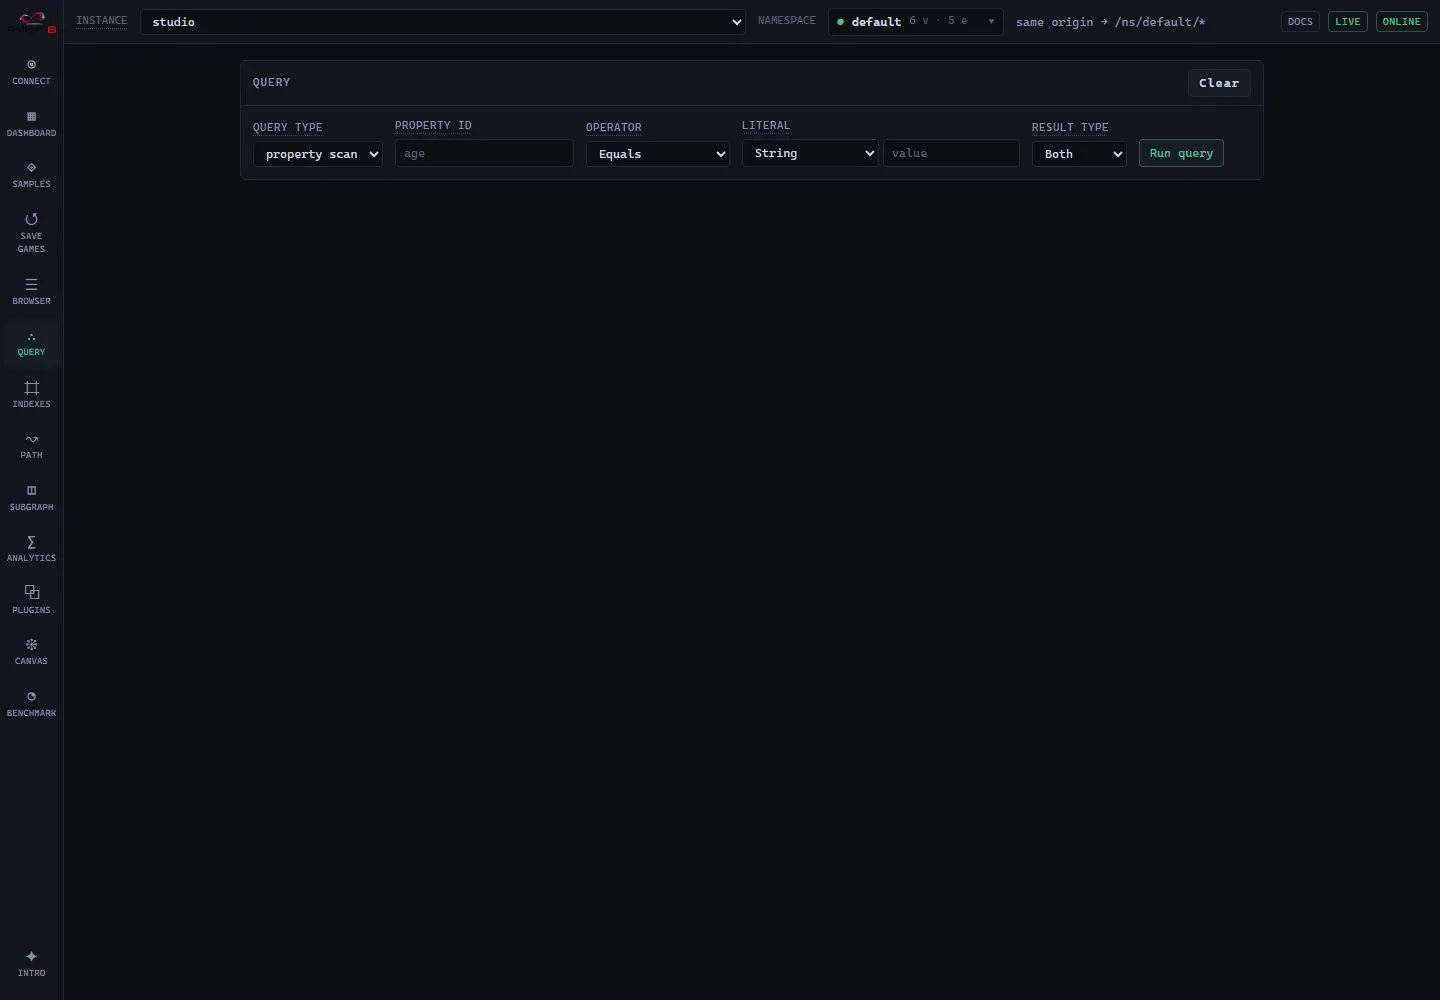
Two modes. A property scan takes a property id, a comparison operator, a typed literal, and a result type (Vertices / Edges / Both). Ask an index picks from the live inventory and offers only the forms the index answers: equality/operator, range, fulltext, spatial, or vector (kNN). A vector query is entered as a pasted vector or as text embedded server-side by the provider, with k, an element-kind filter, and a label constraint. Results report the id count, a vector metric legend (higher/lower is better), fulltext highlights, and a scored table. Index semantics live in indexes.md and vector-search.md.
Stored queries are not managed here: a stored query is unique to its scenario (Path or SubGraph), so it is registered and managed on the Path and Subgraph screens (stored-queries.md).
Canvas
Section titled “Canvas”Renders exactly what you send from the Browser, Query, Path, Subgraph, or Analytics screens — it never auto-loads the whole graph. The style panel is sectioned:
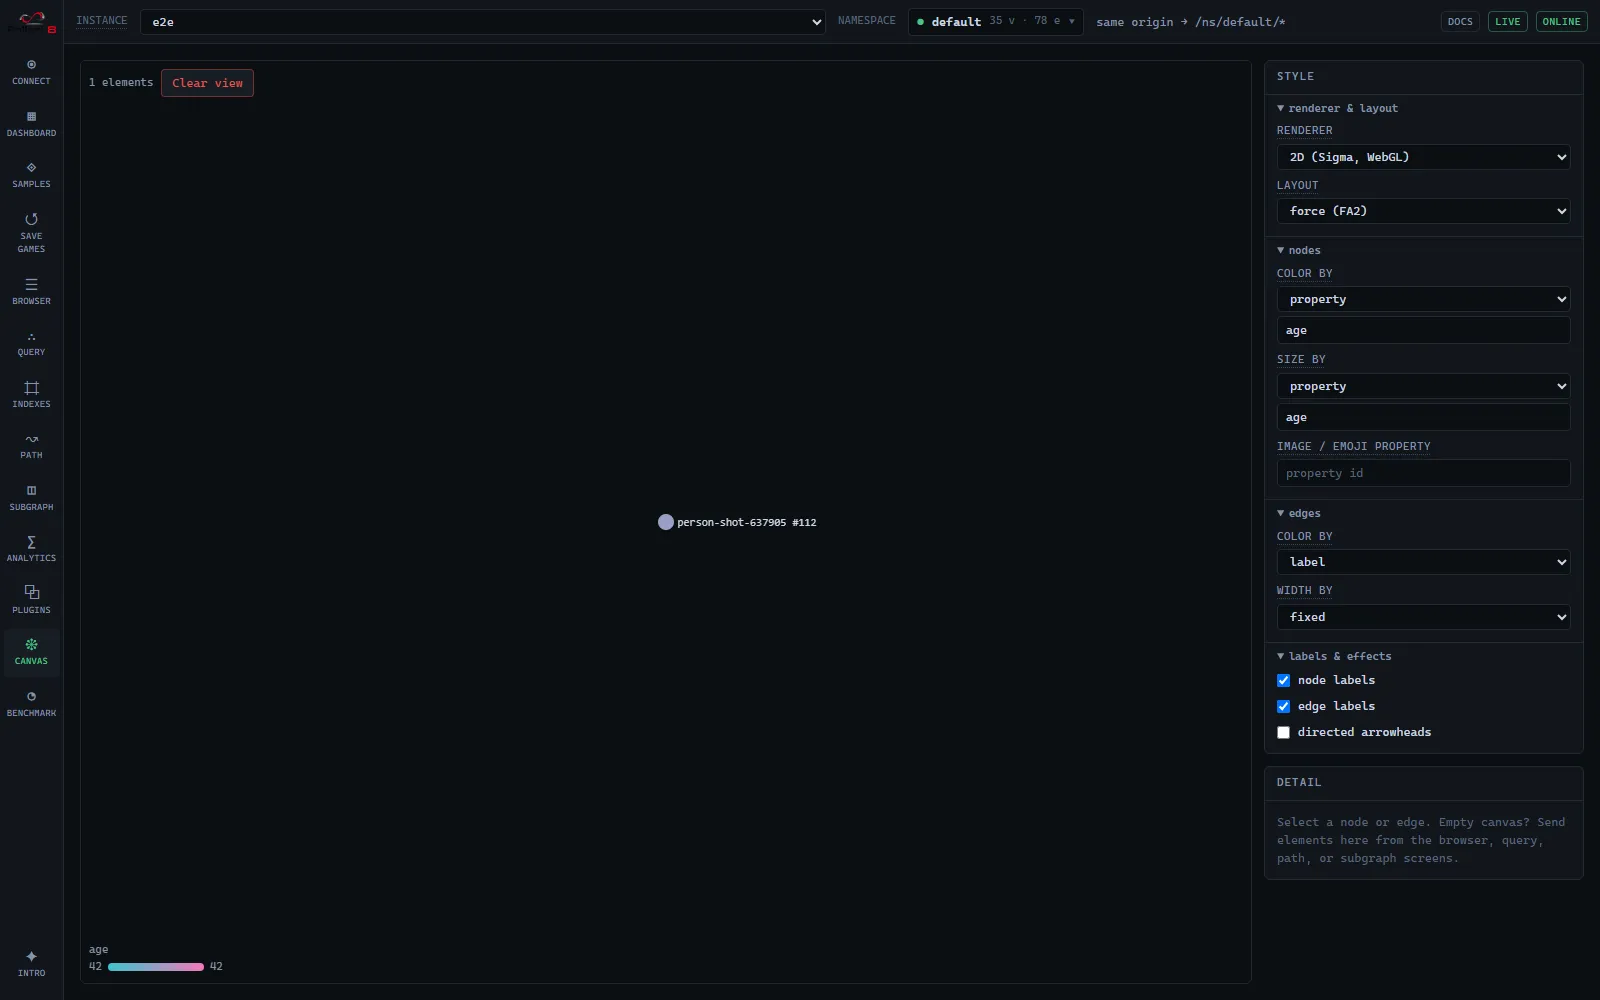
| Section | Controls |
|---|---|
| renderer & layout | 2D (Sigma, WebGL) or 3D (three.js); 2D layouts force/circular/circle-pack/grid/random, 3D force/dag-top-down/dag-radial |
| nodes | color by label or property; size fixed, by property, or by in-/out-/total degree; image or emoji from a property |
| edges | color by label or property; width fixed or by property; directed arrowheads |
| labels & effects | node and edge label toggles |
When you switch color by or size by (and the edge equivalents) to property, a text field appears directly under the picker for the property key. It is seeded with the first property present on the canvas so it is never blank, suggests the other keys as you type, and stays free text, so you set the key yourself. You do not hand-pick the colors: each distinct value gets a stable color from a fixed palette, unless every value is numeric, in which case elements shade along a cyan→pink gradient; missing or blank values render grey. Sizes and widths from a numeric property are min-max scaled into a range. For edges, “label” anywhere on this panel means the display name: the edge’s optional label, falling back to its type, edgePropertyId (edge type vs label).
A legend (categorical or gradient) reflects the active color mode. Selecting a node or edge opens a detail panel with its properties; Expand neighbors merges a vertex’s 1-hop neighborhood, and Remove from view affects only the canvas — it never deletes from the database. A path found on the Path screen arrives as a highlighted overlay.
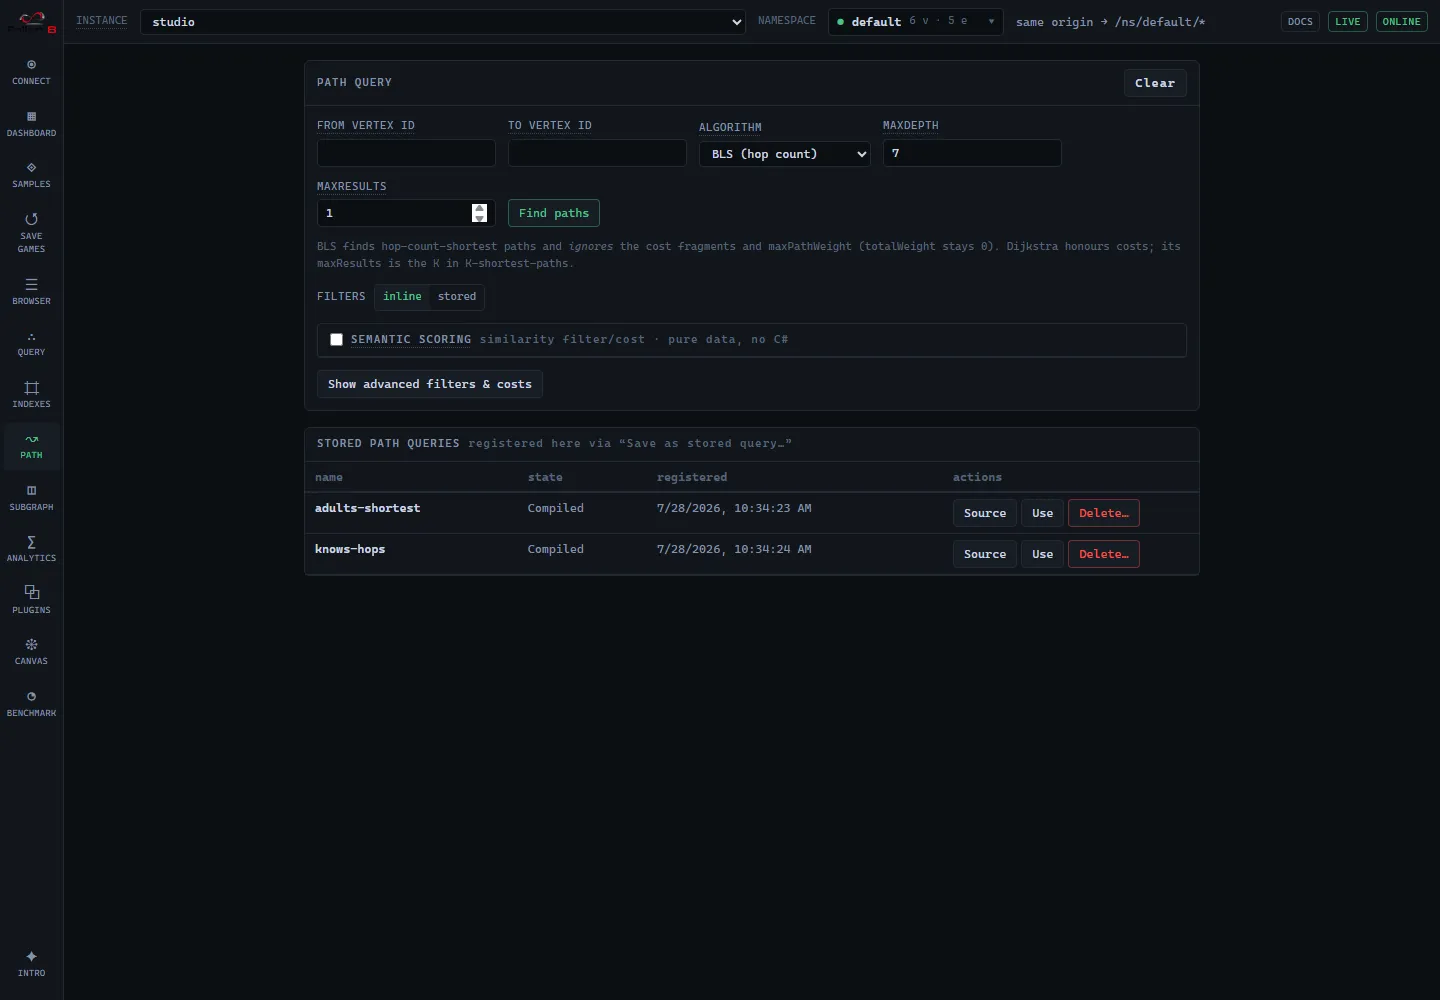
From/to vertex ids, algorithm BLS (hop count) or Dijkstra (weighted), maxDepth, maxResults (the K for Dijkstra’s K-shortest-paths), and maxPathWeight (Dijkstra only; BLS ignores costs). Filters and costs come from inline fragments or a stored query, kept mutually exclusive by a source toggle. The inline advanced tier exposes five delegate slots — filter.vertexFilter, filter.edgeFilter, filter.edgePropertyFilter, cost.vertexCost, cost.edgeCost — each authored in the delegate editor, and the set can be saved as a stored query. A semantic scoring block (query vector + minScore filter + costBySimilarity) is pure data and compiles no C#. Results list each path’s hops and total weight with “Overlay on canvas”. A Stored path queries panel below manages this instance’s Path entries — read-only source, recompile diagnostics, delete, and a Use action that loads one back into the filter picker.
Because fragments are validated in the editor before the query runs, an empty result here is a genuine “no paths found” rather than a swallowed compile error. Inline fragments always run (dynamic code execution is always on); on a key-protected instance they need the API key like any other request. Algorithm behavior: path-finding.md; semantic scoring: semantic-traversal.md.
Subgraph
Section titled “Subgraph”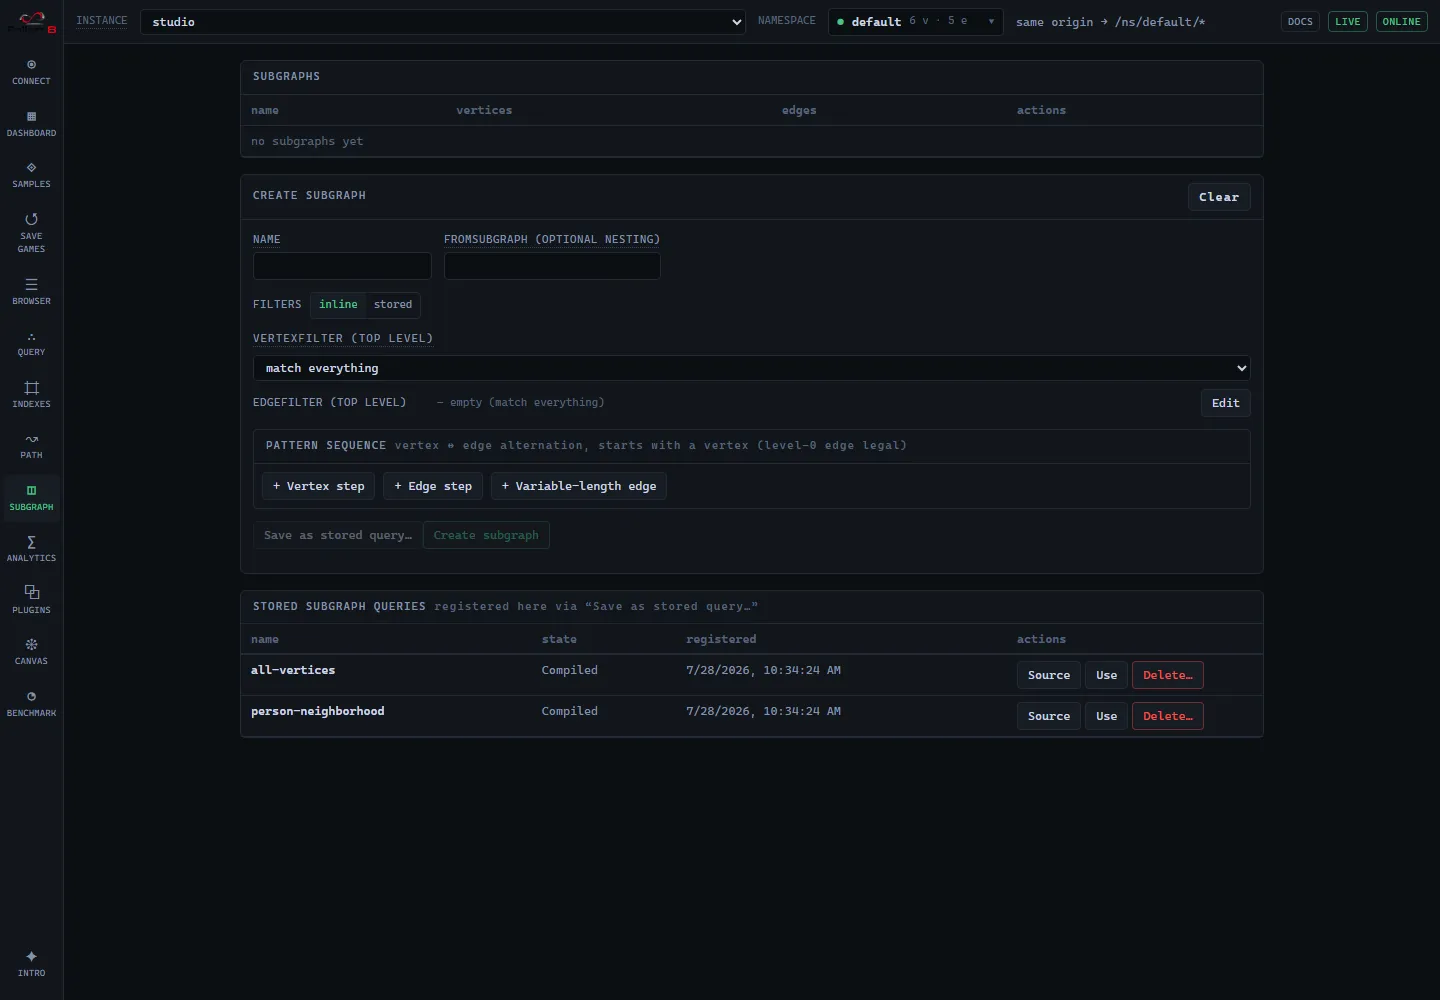
A table lists existing subgraphs (with a badge for semantic ones) offering To canvas / Recalculate / Delete. The create form takes a name and an optional fromSubGraph for nesting, an inline-or-stored source toggle, a top-level vertexFilter (fragment or semantic mode) and edgeFilter, and a pattern sequence builder: add Vertex, Edge, or Variable-length edge steps with type, name, direction, and min/max length. Vertex↔edge alternation is validated as you build. A semantic query section appears when any vertex slot is in semantic mode (one query per request, bound at creation), and the whole specification can be saved as a stored query. A Stored subgraph queries panel below manages this instance’s SubGraph templates — read-only source, recompile diagnostics, delete, and a Use action that loads one into the picker. Concept and rules: subgraphs.md.
Analytics
Section titled “Analytics”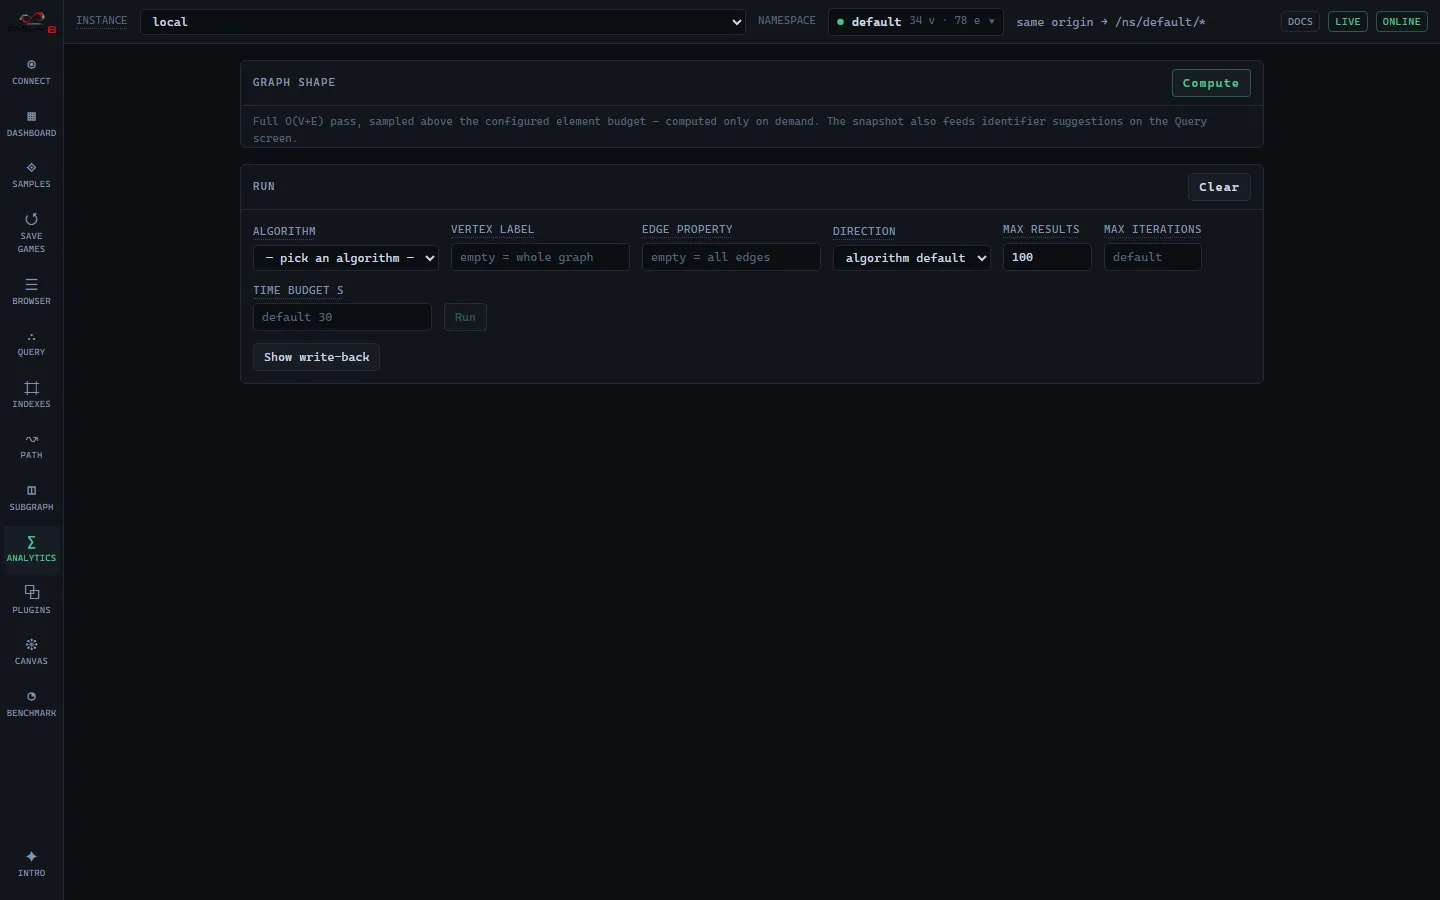
Graph shape runs an on-demand GET /statistics pass — counts, top vertex/edge labels and property keys, degree percentiles, and the index list; its snapshot also feeds identifier suggestions across Studio. Run picks an algorithm from the live plugin list, scopes it by vertex label / edge property / direction, and sets max results, max iterations, and a time budget (PageRank adds damping and epsilon). Optional write-back stamps each score onto a vertex property (snapshot-durable only), which you can then color by on the Canvas to read results spatially. The result panel shows convergence, statistics, partitions with paged members, and a scored table. A run already in progress returns 429; an exhausted budget returns 408. Algorithms and semantics: graph-analytics.md.
Plugins
Section titled “Plugins”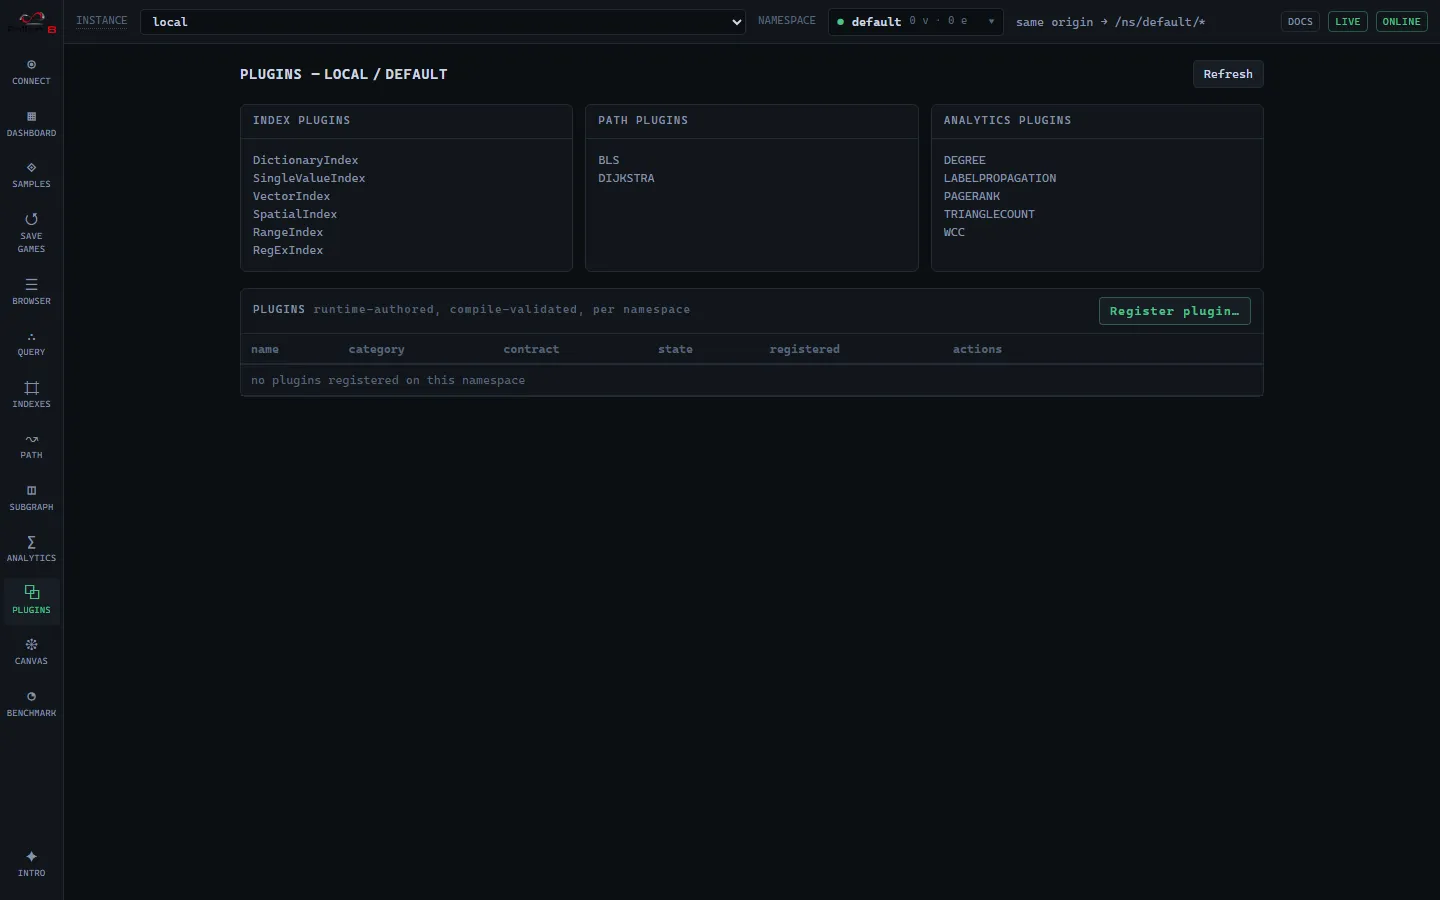
The one home for everything plugin-related. The top row shows the built-in plugin families discovered on the engine (index / path / analytics) from GET /status. Below it, the registry table lists the active namespace’s runtime-authored, compile-validated plugins — name, category, contract, and compile-state badge — with read-only source and recompile diagnostics, a function runner for a registered graph function, and delete (entries are immutable: delete and re-register is the edit flow). Register plugin… opens the whole-type authoring editor. Registrations are per namespace. Concept and REST: plugins.md.
Indexes
Section titled “Indexes”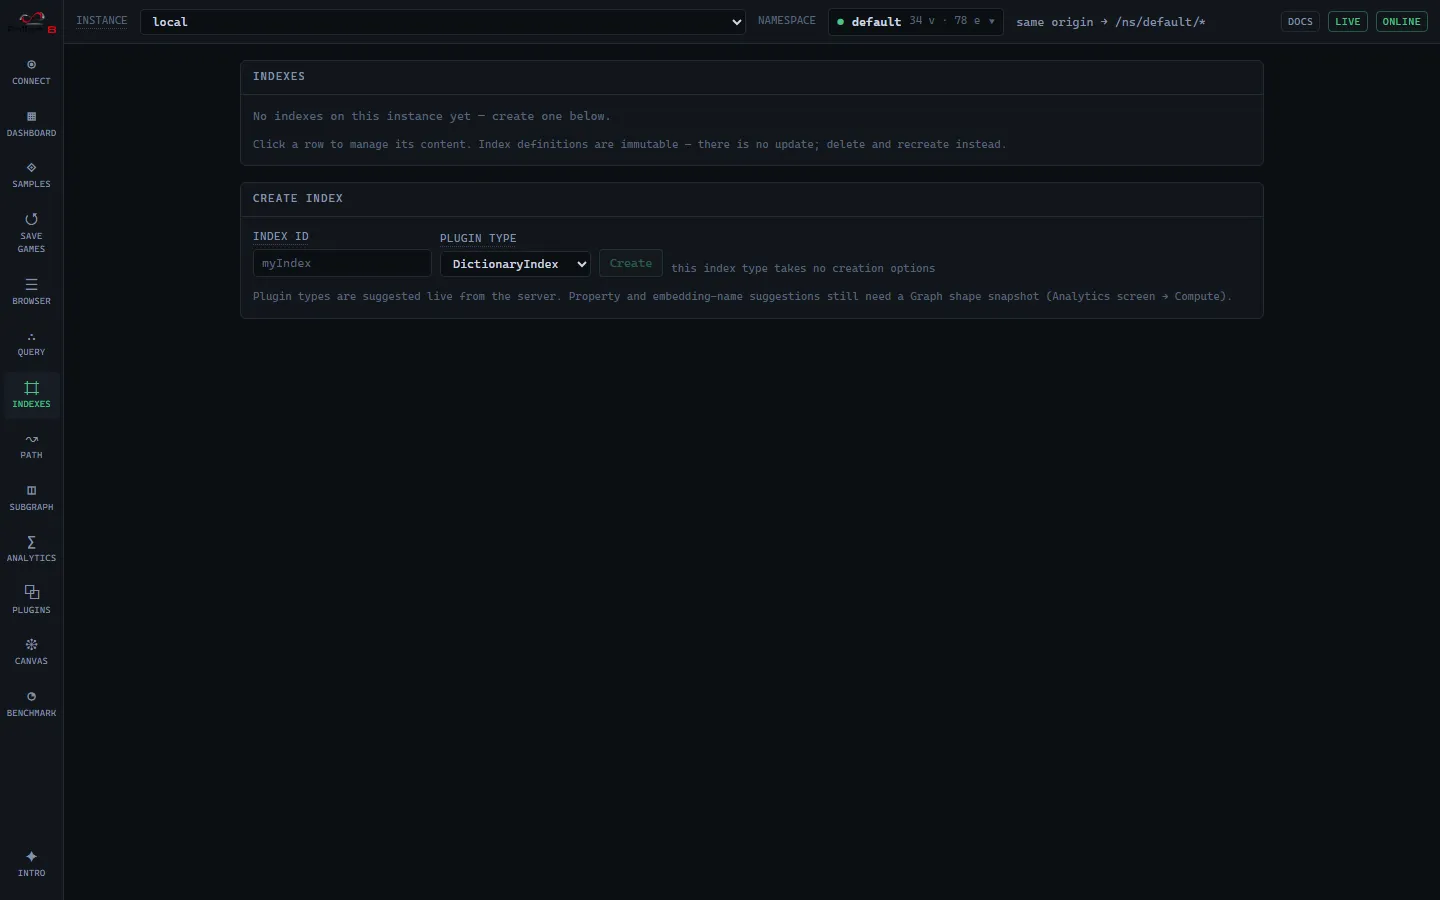
The inventory table shows each index’s id, type, query capabilities, key/value counts, and a binding badge when a vector index is bound to a named embedding (a self-maintained projection). Row actions are Query (jumps to the Query screen with the index preselected) and Delete (typed confirm). Create takes an id and plugin type; a VectorIndex adds dimension, metric, and an optional embedding binding and model. SpatialIndex cannot be created over REST. Per-index content management (typed-key add/remove, vector add, element remove) follows the index’s capabilities — a bound vector index manages its own content and rejects manual writes. Index types and REST: indexes.md.
Save games
Section titled “Save games”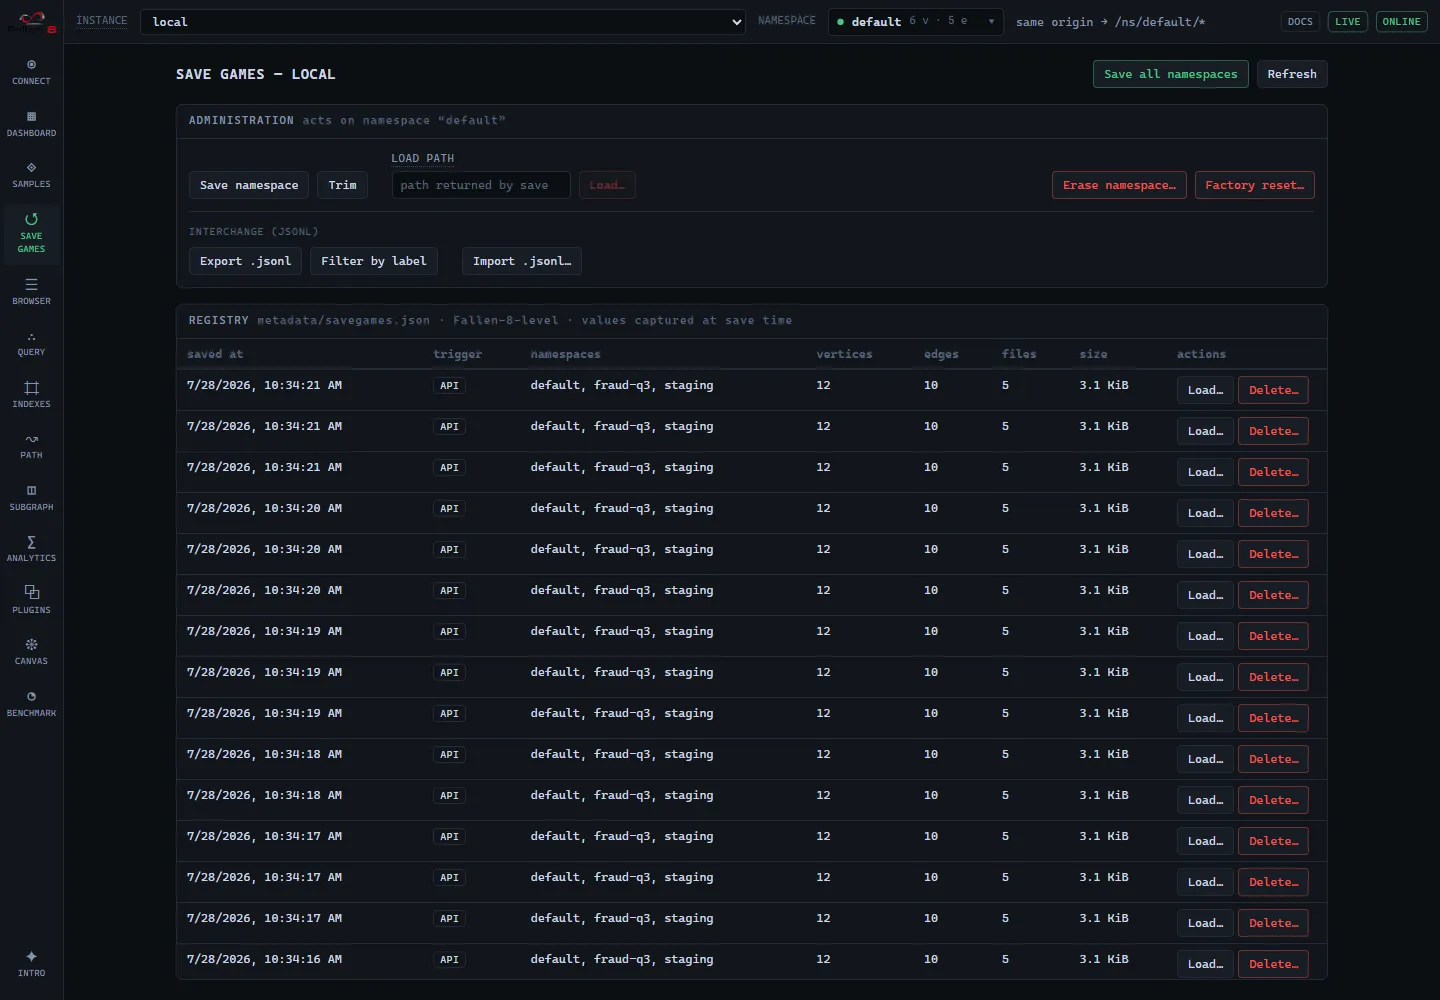
The persistence home. The top is the Administration section, holding the namespace-scoped persistence and lifecycle actions (they act on the active namespace shown in the top bar): Save namespace, Trim, Load from a checkpoint path, Erase namespace, and the Fallen-8-wide Factory reset (the destructive actions require typing the target name). An interchange (jsonl) subsection exports the graph (optionally filtered by label or edge type) and imports jsonl into an empty graph — import requires an empty target, which the server enforces with a 409 (bulk-import-export.md).
Below it is the persistent checkpoint registry as a Fallen-8-level table: saved-at, trigger, member namespaces, aggregate counts, file count, and size. “Save all namespaces” writes one entry spanning every namespace; Load restores the entire entry or a single namespace (typed confirm); Delete optionally removes the checkpoint files on disk. The registry lists every entry; once it grows past about fifteen rows it caps its height and a scrollbar scrolls through the rest, so a long save history never grows the page (no rows are hidden below a 10,000-row safety ceiling). Semantics: save-games.md.
Benchmark
Section titled “Benchmark”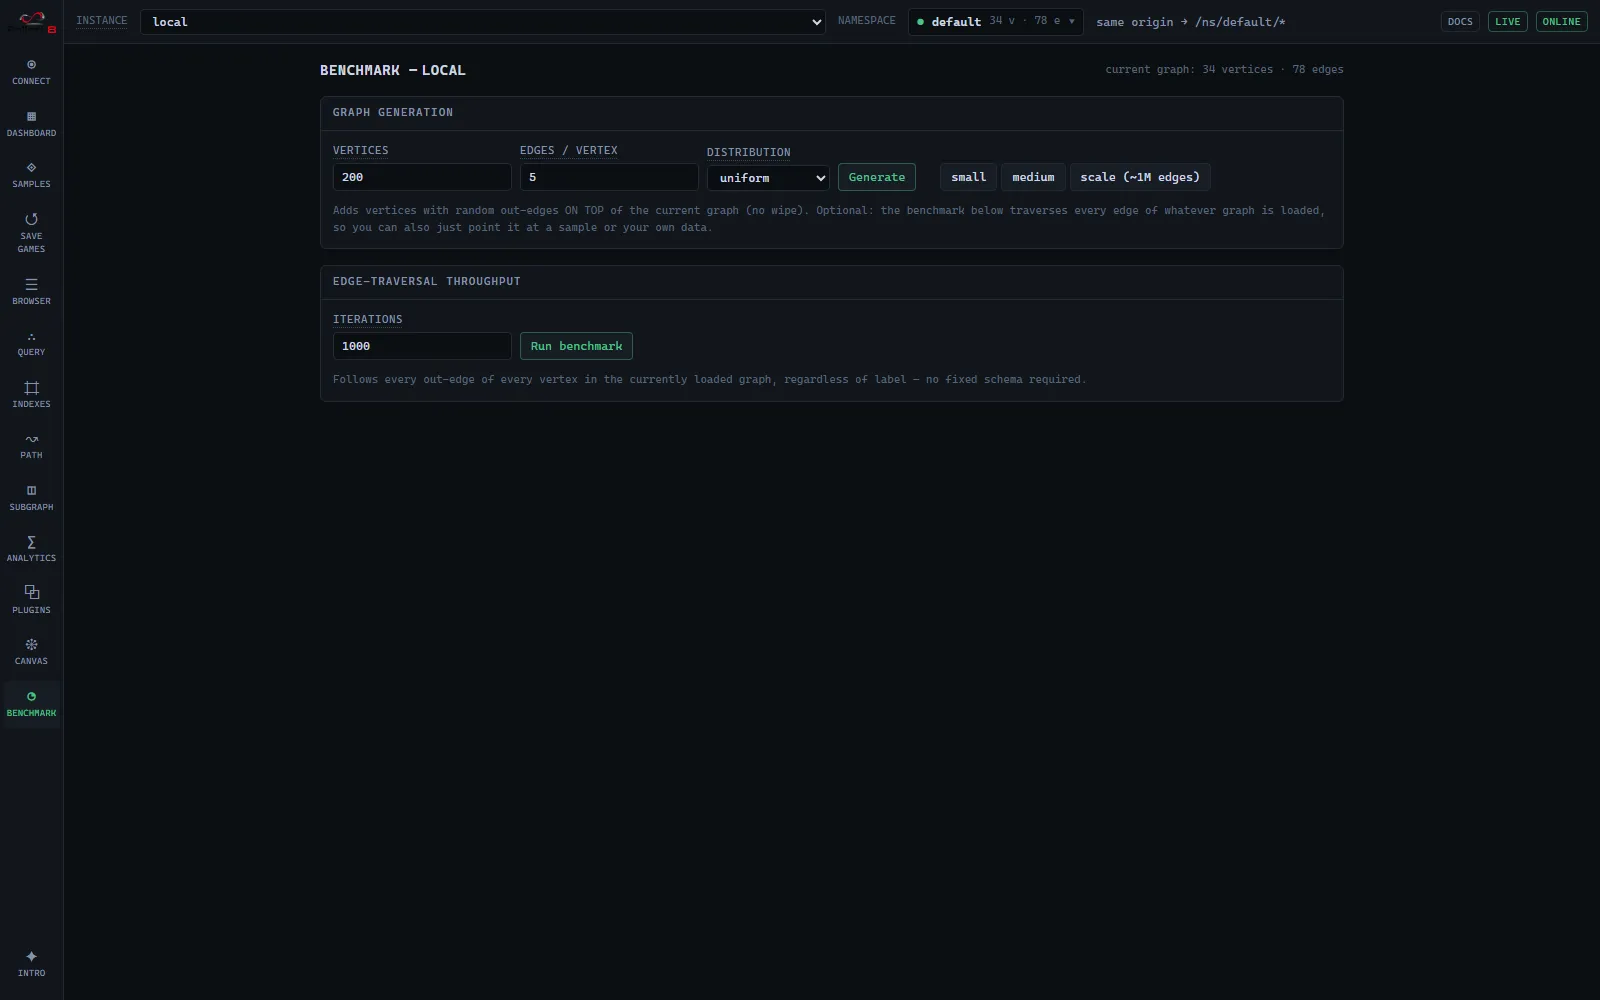
Fallen-8-level. Graph generation adds random vertices with out-edges on top of the current graph (no wipe), with small/medium/scale presets and uniform or preferential distribution. The edge-traversal benchmark follows every out-edge of every vertex in the currently loaded graph — regardless of edge type, so it needs no fixed schema — and reports edges per run and average/median/stddev TPS, with a per-session history. It measures raw edge-traversal throughput, not query latency or analytics. Generation is a convenience for conjuring a graph of a chosen size to measure; you can equally point the benchmark at a sample dataset or your own data.
The delegate editor
Section titled “The delegate editor”Opened from every fragment slot on the Path and Subgraph screens (the Query screen uses no fragments). It is a Monaco C# editor with per-kind snippets for the five slot types — VertexFilter, EdgeFilter, EdgePropertyFilter, VertexCost, EdgeCost. It validates as you type against the server (POST /delegates/validate) and renders diagnostics inline at the returned positions; Use fragment is blocked until the exact text on screen has passed validation (an empty fragment means “match everything”). Validation and inline fragment execution are always available; they only need the instance’s API key when one is configured (security.md). The compilation model is owned by delegates.md.
NL assist
Section titled “NL assist”The editor’s side panel drafts a fragment from a natural-language description, calling a model through one of two backends:
| Setting | Detail |
|---|---|
| backend | this Fallen-8 instance (default) or custom endpoint (browser-direct) |
| instance mode | browser → the active instance’s POST /chat → its model backend (the Ollama sidecar). The model is server-owned (Fallen8:Chat:Ollama:Model, default phi4-f8-mini); nothing to configure. Needs the instance’s chat gateway enabled (Fallen8:Chat:Enabled / F8_CHAT) — semantic-traversal.md. |
| custom mode | the browser calls the endpoint directly; api kind ollama or openai-compatible; presets for the fine-tuned phi4-f8-mini/phi4-f8, stock phi4-mini/phi4, OpenAI, Anthropic. Any API key is held only in the browser and never sent to a Fallen-8 instance. |
Instance mode is the default because Fallen-8 is now the semantic gateway (embeddings and chat both proxy through the instance). This retires the earlier “never through the Fallen-8 instance” rule for the default path — the prompt travels to the same instance you already trust with your graph, so instance mode shows no egress notice; the surviving guarantee is that a custom endpoint and its key stay browser-direct and never reach F8. A non-loopback custom endpoint still shows the “text leaves this machine” notice.
Each draft is inserted as ordinary editable text and run through the same validation the editor uses, never auto-submitted; on an invalid draft the editor feeds the compiler diagnostics back to the model and retries a bounded number of times before stopping. Drafts accumulate in a scrollable list with the newest on top; each is highlighted as awaiting review until you judge it 👍/👎, and the rated ones can be exported as training examples. A model that is not present on the backend makes the call 404 (troubleshooting.md). The plugin authoring editor’s NL panel works the same way.
Server capabilities Studio uses
Section titled “Server capabilities Studio uses”Studio degrades gracefully when a capability is off, but these features need server-side support:
| Studio capability | Needs on the server | Docs |
|---|---|---|
| Delegate validation + inline path/subgraph filters & costs | The API key when one is configured (dynamic code is always on) | security.md |
| NL assist drafting (instance mode, default) | The chat gateway enabled (Fallen8:Chat:Enabled / F8_CHAT) + its Ollama backend reachable |
semantic-traversal.md |
| NL assist drafting (custom mode) | A reachable model backend the browser calls directly (OLLAMA_ORIGINS for a browser-direct Ollama) |
security.md |
| Text-in embedding, semantic search, text query vectors | Embedding provider enabled | semantic-traversal.md |
| Stored-query invocation (Path / Subgraph) | Nothing (invocation is never gated) | stored-queries.md |
| Live chip and push refreshes | Change feed enabled | change-feed.md |
| “Any GitHub repo” sample card | Internet access to GitHub’s dependency graph | samples.md |
See also
Section titled “See also”- running.md — how Studio is built and served
- delegates.md — the delegate model Studio helps you author
- namespaces.md · security.md · rest-api.md — the model and surface behind the UI