

Sample gallery
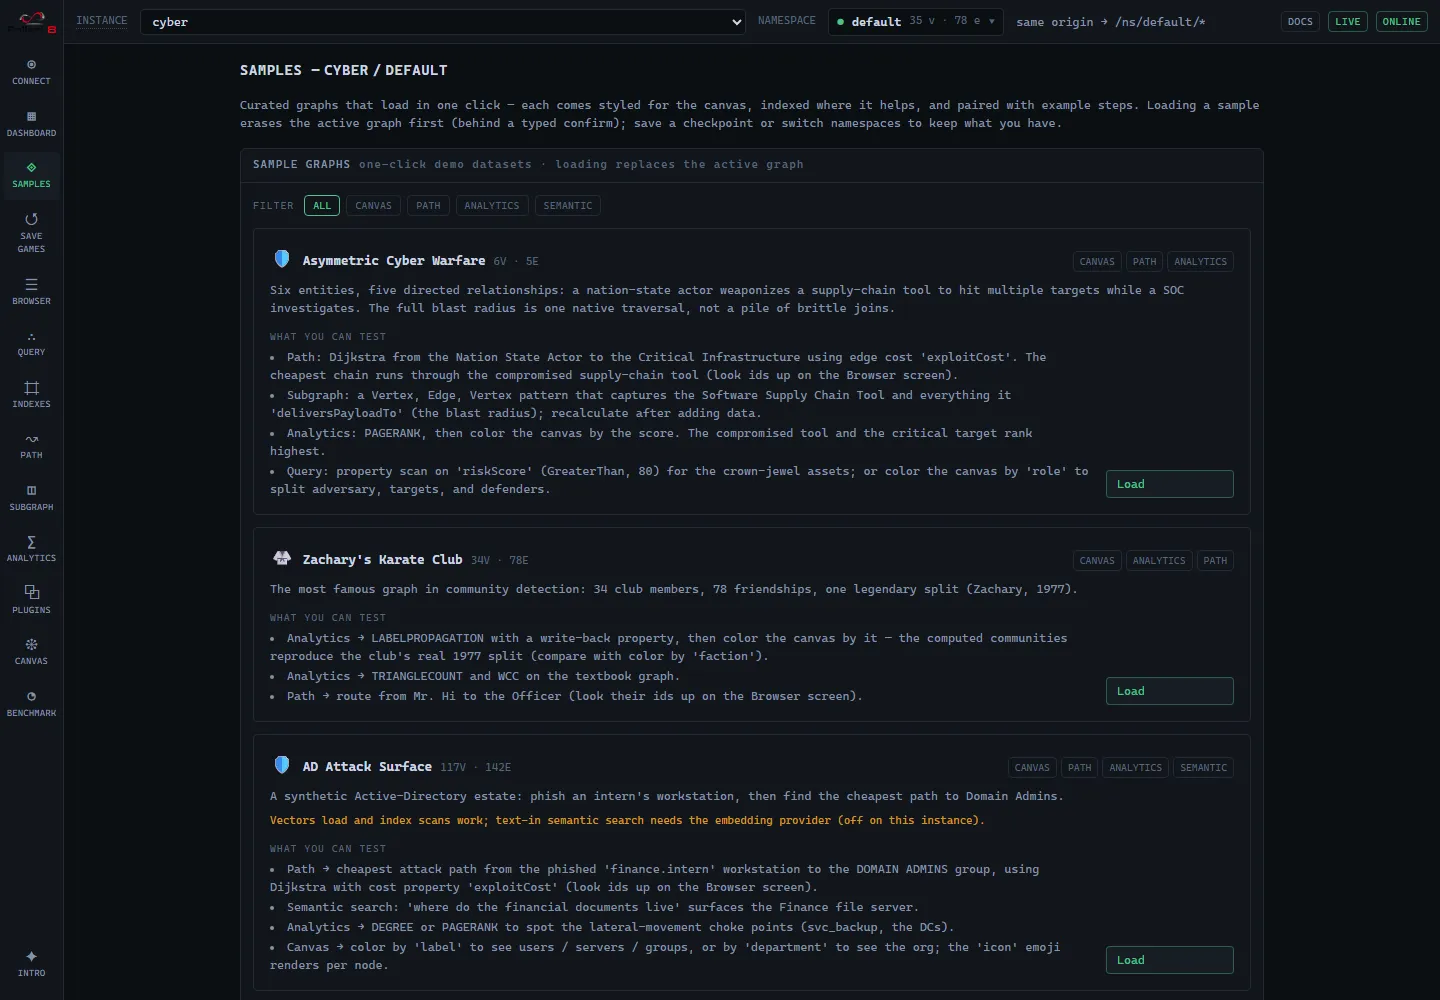
F8 Studio’s Samples screen ships a gallery of curated graphs that load in one click. Each comes styled for the canvas, indexed where it helps, and paired with example queries, so every card is a short guided tour of a different Fallen-8 capability — analytics, weighted paths, semantic search, visualization. A tag bar at the top filters the gallery by capability. This doc walks through each one, with screenshots and queries you can run yourself.
How loading works
Section titled “How loading works”Clicking Load fetches the dataset, imports it, builds the sample’s indices, and re-reads the
elements onto the canvas with the sample’s style — no embedding work happens at load time,
because the vectors are baked into the file. The datasets ship with the app and are served
same-origin from /samples by default, so the gallery shows exactly the samples the app was
built with and works offline; set VITE_F8_SAMPLES_BASE to fetch them from a remote mirror or a
fork instead.
- Import needs an empty graph (ids must not clash). Loading into a non-empty instance is gated behind a typed-name confirm that erases first — save a checkpoint (save games) if you need the current data, or switch to a fresh namespace.
- The datasets are
fallen8-jsonl— the same format bulk import/export uses, fetched and streamed throughPOST /bulk/import. - Bring-your-own-vector always works. The embedded samples carry their vectors in the file, so vector scans work even with no embedding provider. The text-in features (semantic search by typed text) additionally need a provider whose model identity matches the baked vectors — each card tells you whether that works on the current instance. See semantic traversal.
The samples
Section titled “The samples”🛡️ Asymmetric Cyber Warfare — 6 vertices, 5 edges
Section titled “🛡️ Asymmetric Cyber Warfare — 6 vertices, 5 edges”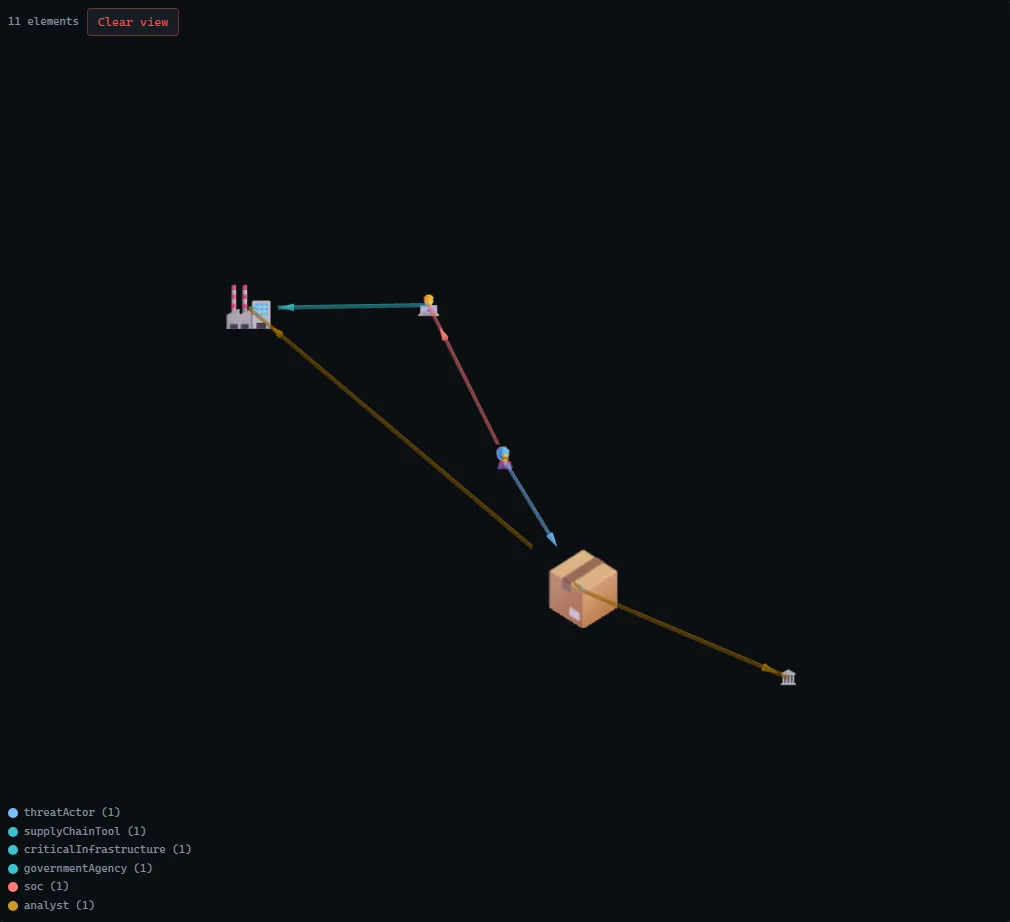
A tiny, story-driven graph: a nation-state actor weaponizes a compromised software supply-chain tool to deliver a payload to two targets (critical infrastructure and a government agency), while a SOC and its analyst investigate. Six entities, five directed relationships, emoji nodes, and labelled edges. It is the same graph the first-run walkthrough animates. The point: the full blast radius of a compromise is a single native traversal here, versus the brittle multi-table joins a relational store forces.
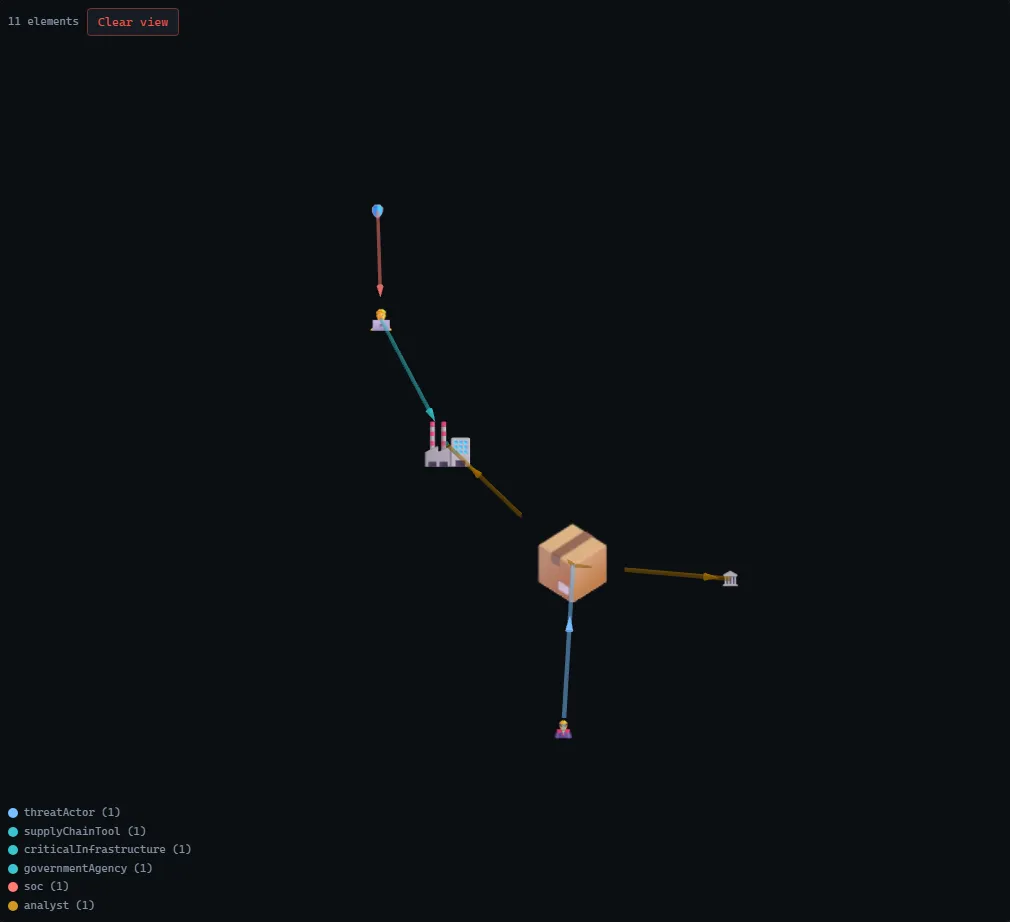
The same graph in the 3D renderer with a force layout:
Try it:
- Path from the Nation State Actor to the Critical Infrastructure to see the blast radius of a supply-chain compromise (look ids up on the Browser screen).
- Subgraph capturing the Software Supply Chain Tool and everything it delivers to, then recalculate it as the graph changes.
- Analytics →
PAGERANK, then color the canvas by the score: the compromised tool and the critical target rank highest.
🥋 Zachary’s Karate Club — 34 vertices, 78 edges
Section titled “🥋 Zachary’s Karate Club — 34 vertices, 78 edges”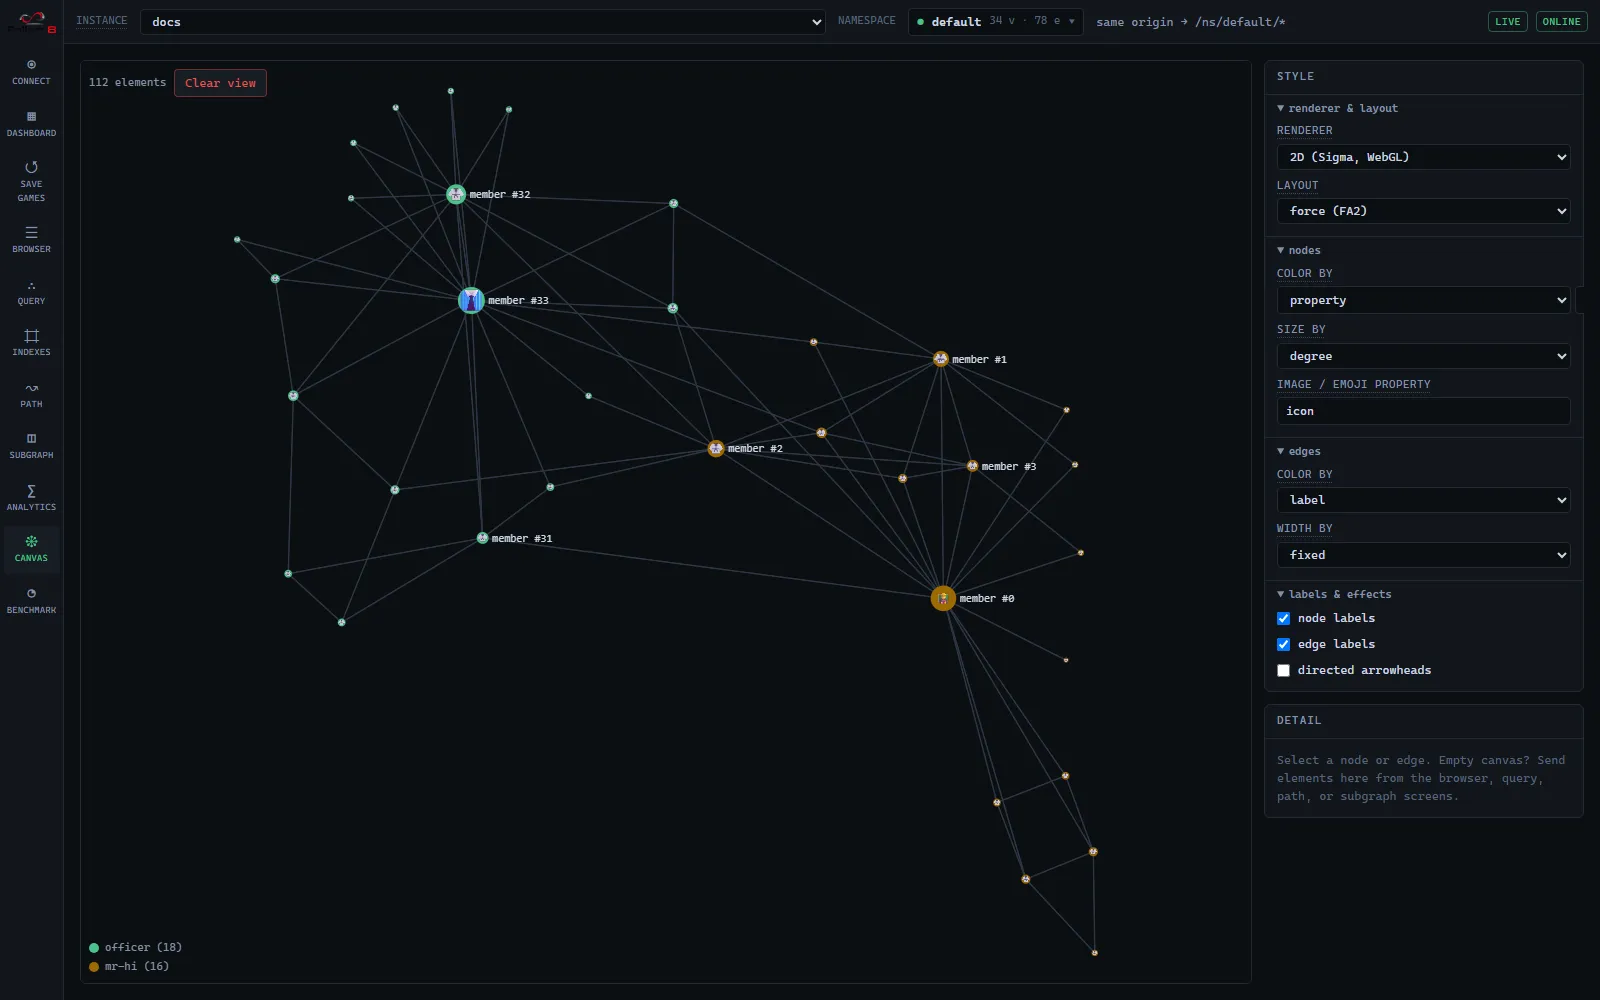
The most famous graph in community detection: club members, friendships, and the real 1977
split. Nodes are colored by faction and sized by degree, so the two camps and their leaders
(member #0 and #33) are obvious at a glance.
Try it:
- Analytics →
LABELPROPAGATIONwith write-back, then color the canvas by the computed community — it reproduces the club’s real split (compare with color byfaction). TRIANGLECOUNTandWCCon the textbook graph.- Path from Mr. Hi to the Officer (look their ids up on the Browser screen).
🛡️ AD Attack Surface — 117 vertices, 142 edges
Section titled “🛡️ AD Attack Surface — 117 vertices, 142 edges”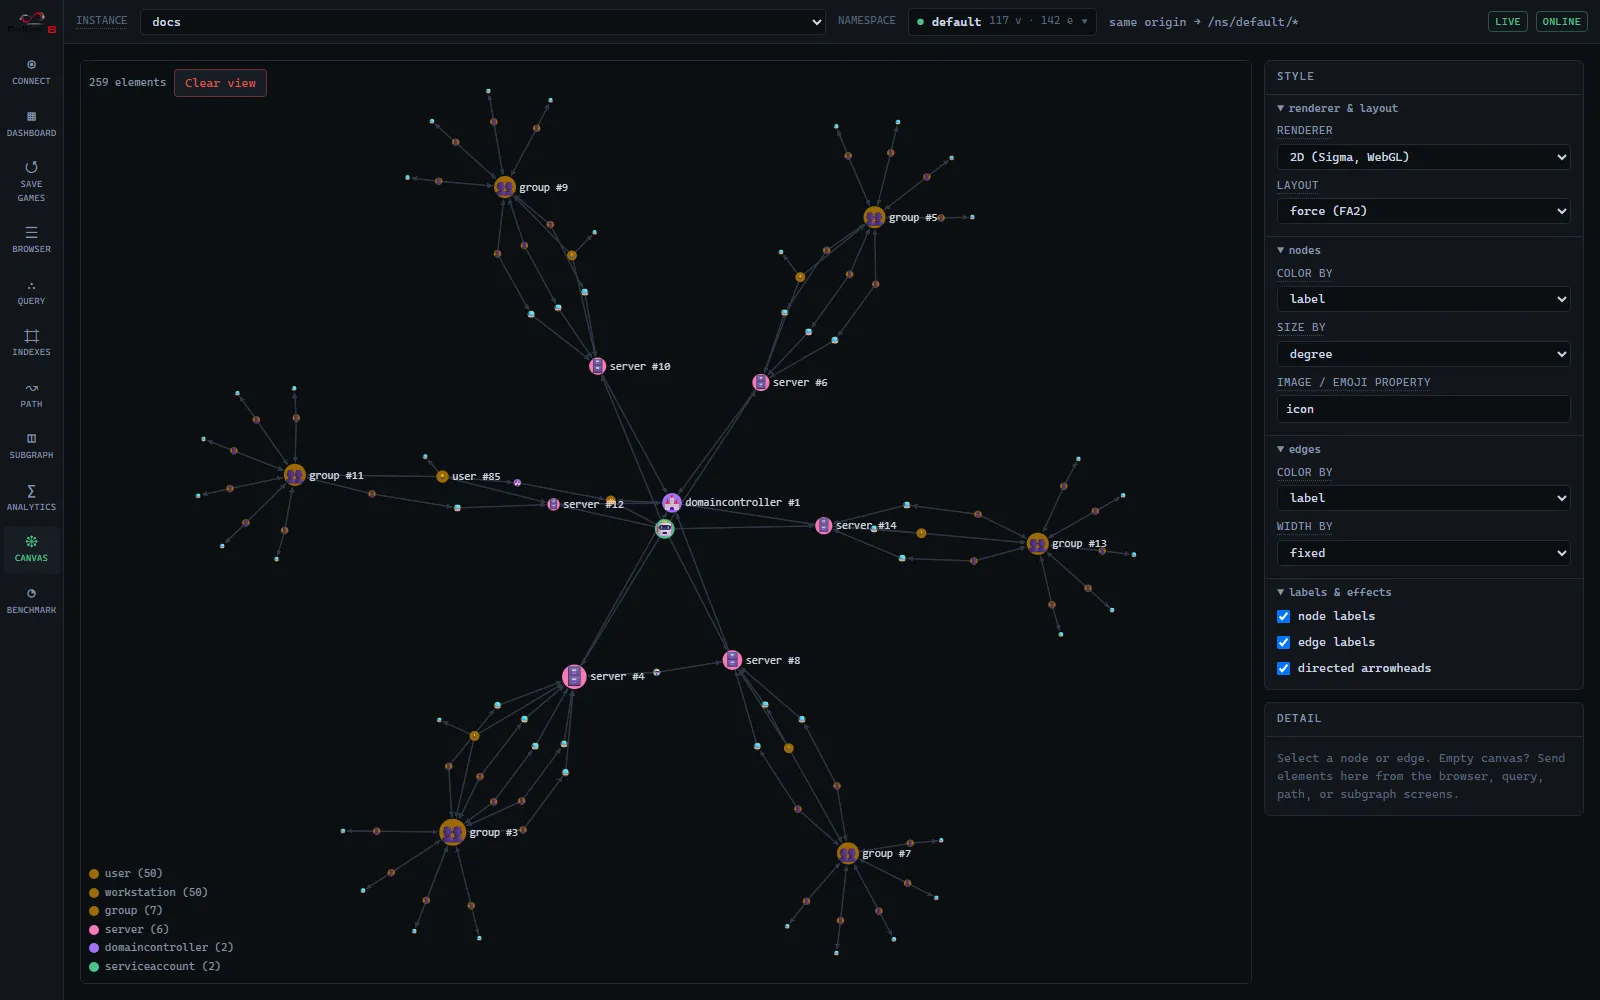
A synthetic Active-Directory estate: users, workstations, servers, and groups. The scenario is a red-team classic — phish an intern, then find the cheapest path to Domain Admins. Ships with a bound vector index for semantic search.
Try it:
- Path → Dijkstra from the phished
finance.internworkstation to theDOMAIN ADMINSgroup, using cost propertyexploitCost— the result is the cheapest attack chain. - Semantic search: “where do the financial documents live” surfaces the Finance file server.
- Analytics →
DEGREE/PAGERANKto spot lateral-movement choke points.
🎬 Movie Night — 191 vertices, 1,697 edges
Section titled “🎬 Movie Night — 191 vertices, 1,697 edges”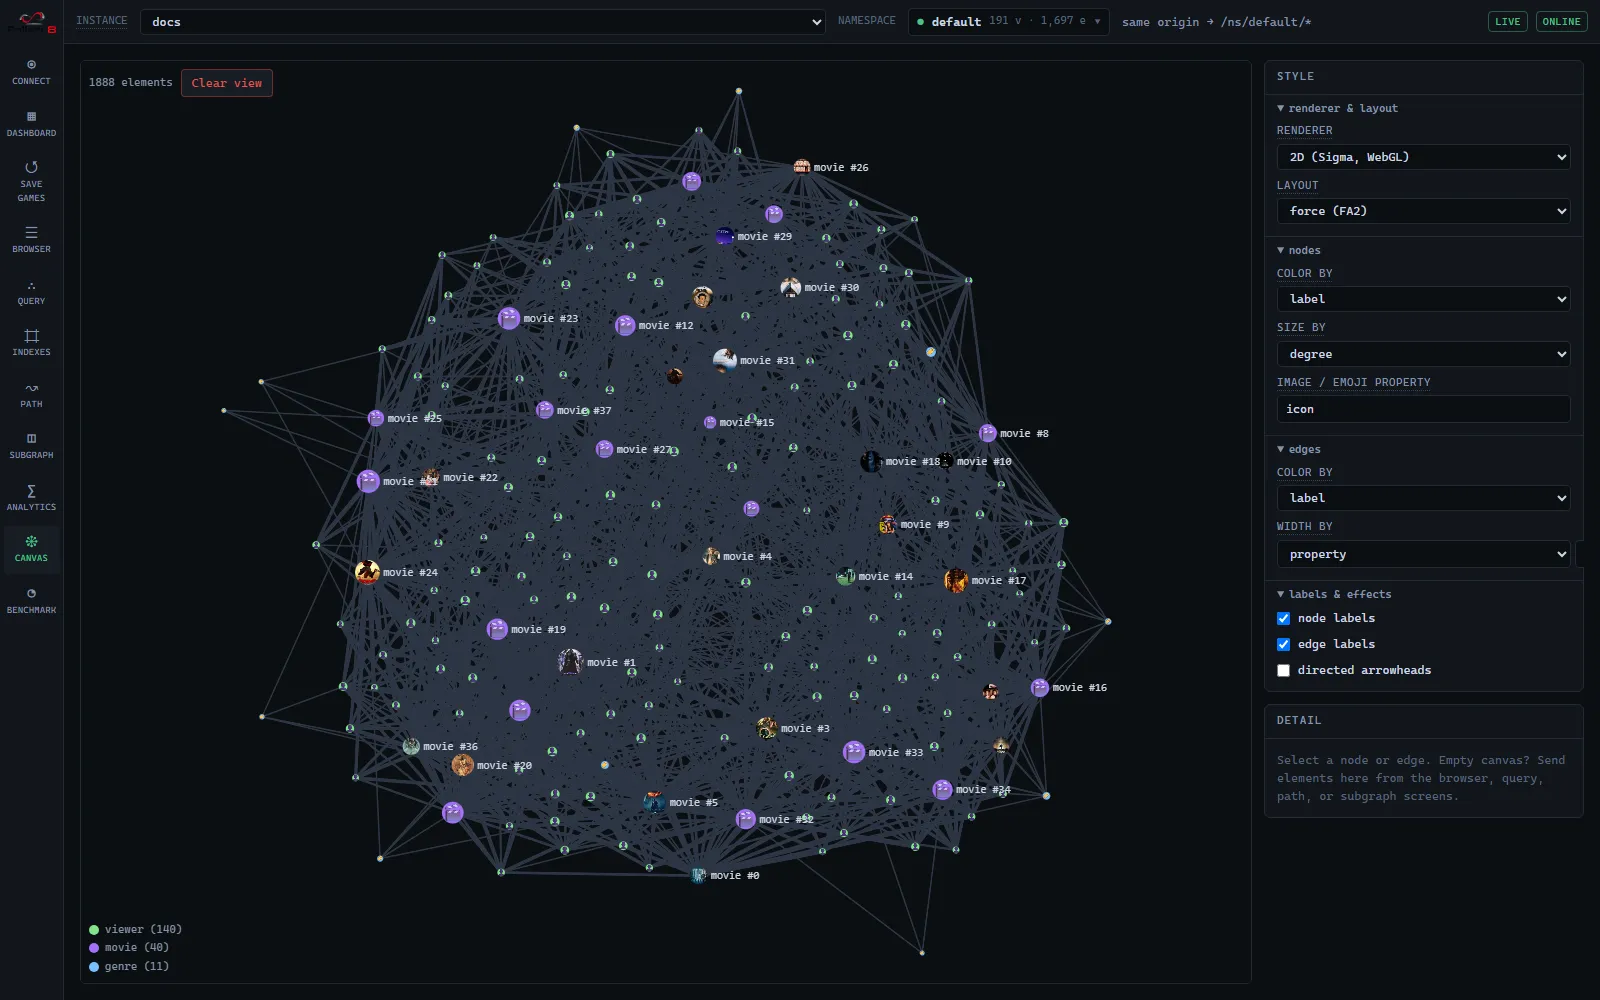
Films, genres, and viewers with real taste communities — poster-image nodes, plot embeddings, and rating-weighted edges. The richest sample for semantic and recommendation work.
Try it:
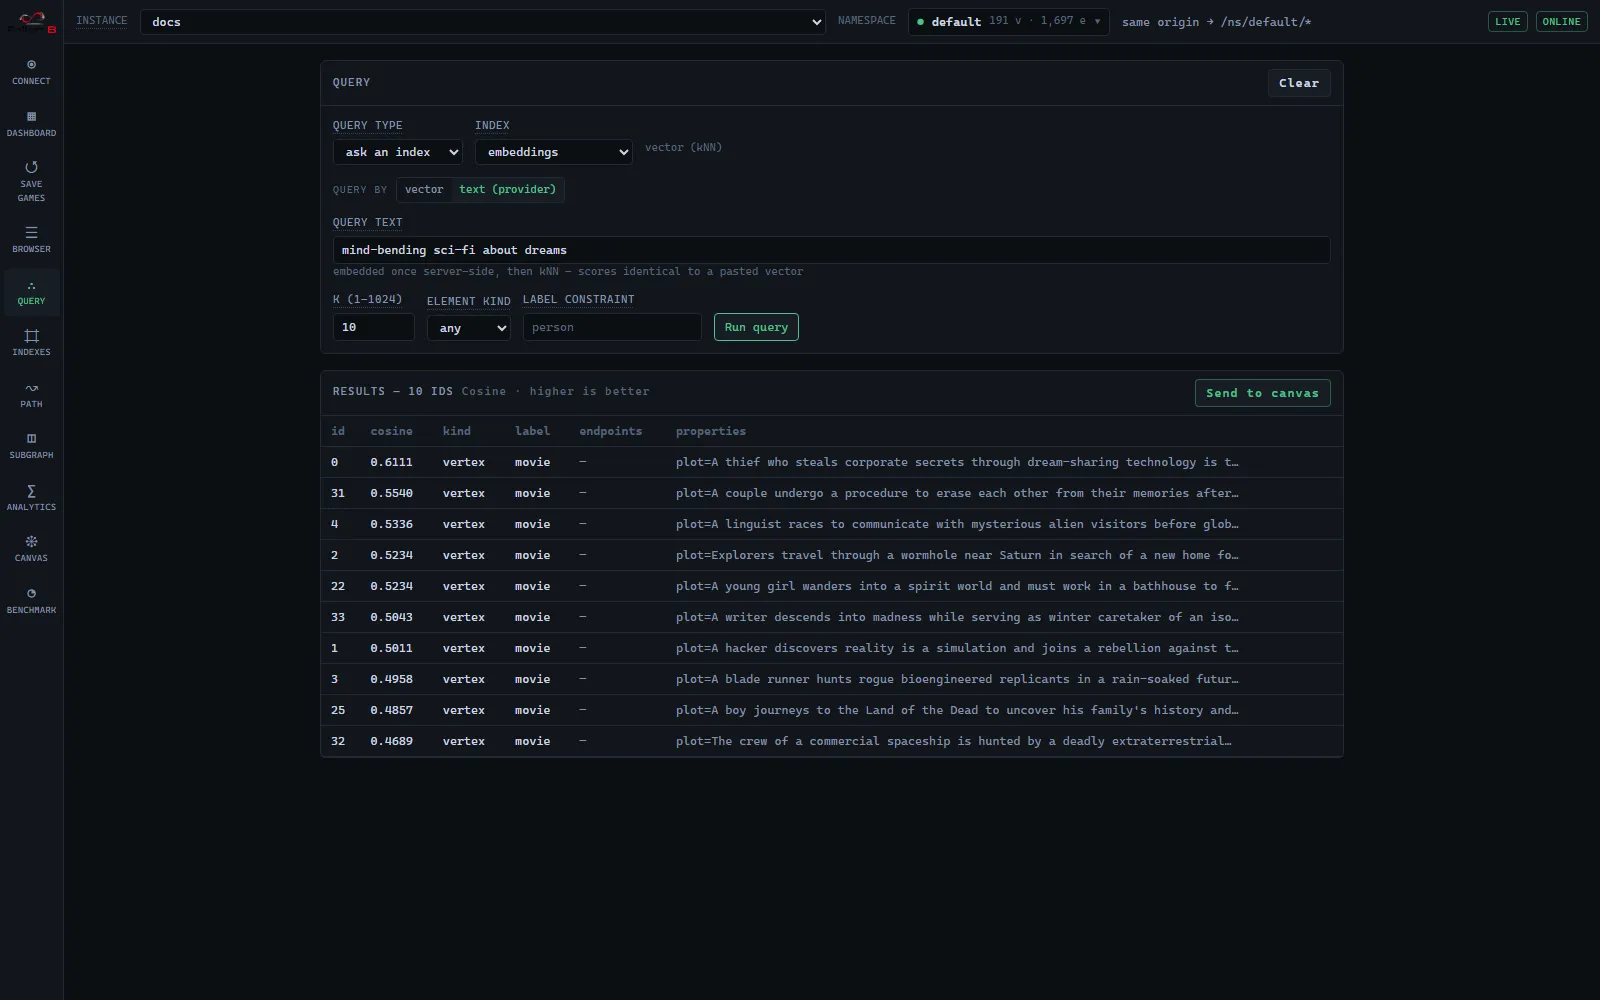
- Semantic search: “mind-bending sci-fi about dreams” surfaces Inception; “a haunted hotel” finds The Shining (see the worked example below).
- Path: a 2-hop viewer → movie → viewer → movie chain is a recommendation.
- Analytics →
PAGERANKranks the canon;LABELPROPAGATIONrecovers the taste communities.
✈️ World Air Routes — 250 vertices, 5,702 edges
Section titled “✈️ World Air Routes — 250 vertices, 5,702 edges”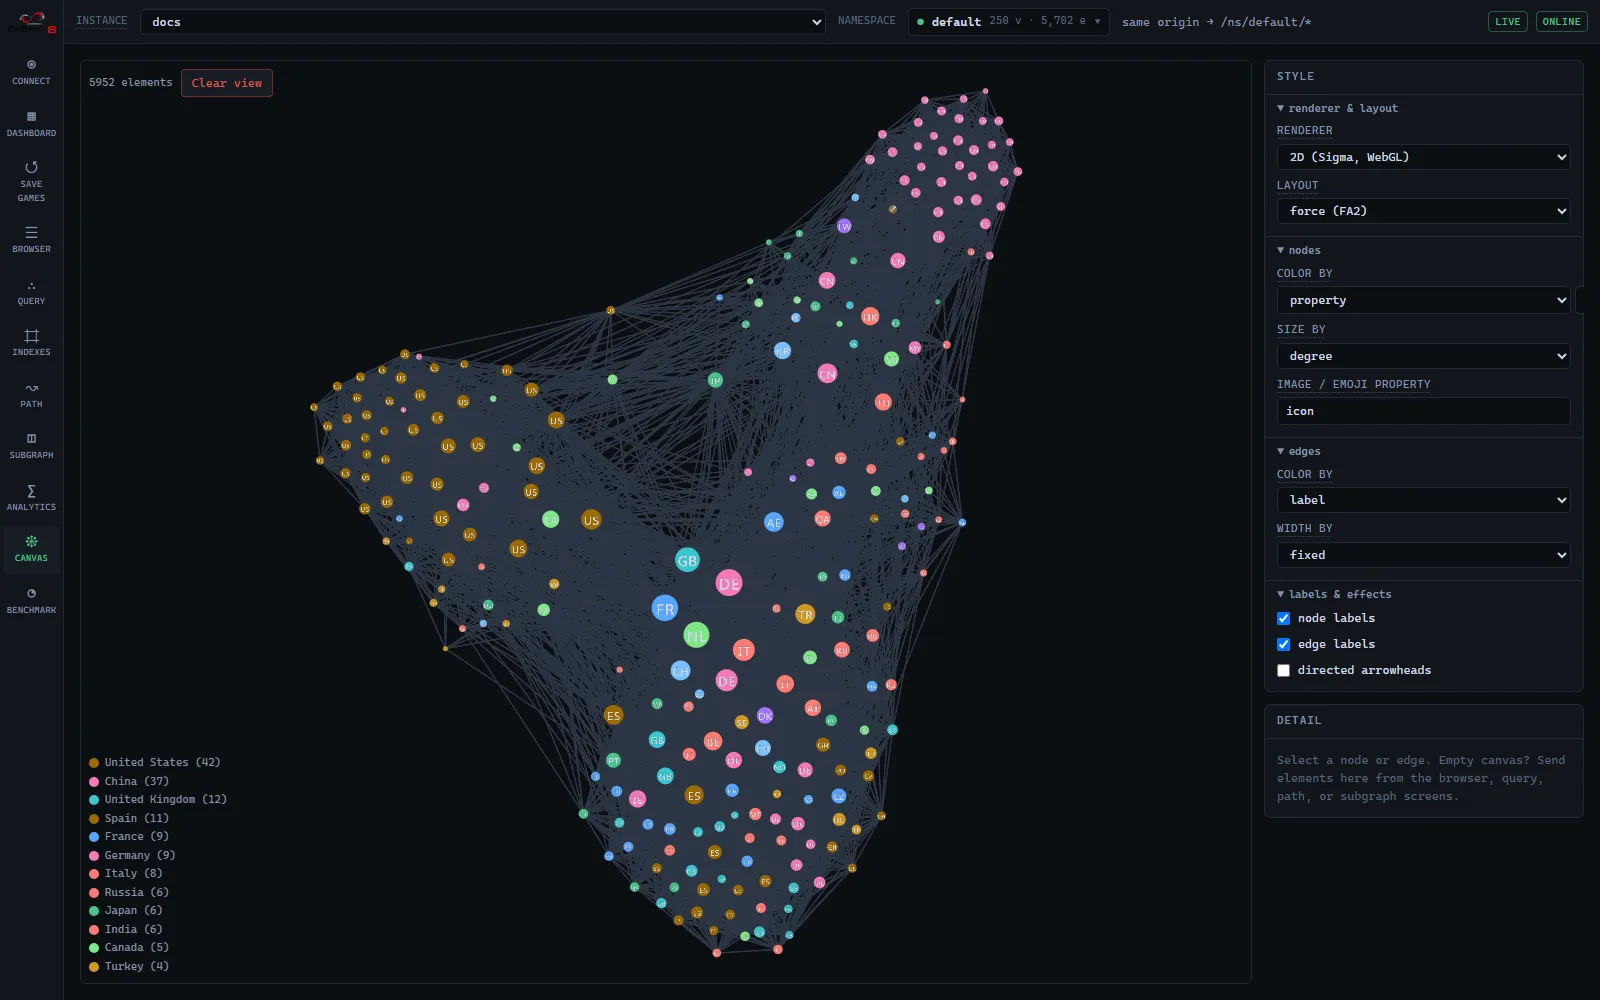
The 250 busiest airports and the flights between them (OpenFlights), colored by country and
sized by degree so the mega-hubs (US, GB, DE, FR…) pop. Each node carries its country flag as
its icon; where the browser has no flag-emoji font it falls back to the two-letter country
code, as in the shot above.
Try it:
- Path → Dijkstra on cost property
kmbetween two airports — a real minimum-distance itinerary. - Semantic search: “major airports in Japan” or “busiest hubs in the Middle East”.
- Analytics →
PAGERANK/DEGREEto rank the global hubs.
📦 Fallen-8 Dependencies — 392 vertices, 517 edges
Section titled “📦 Fallen-8 Dependencies — 392 vertices, 517 edges”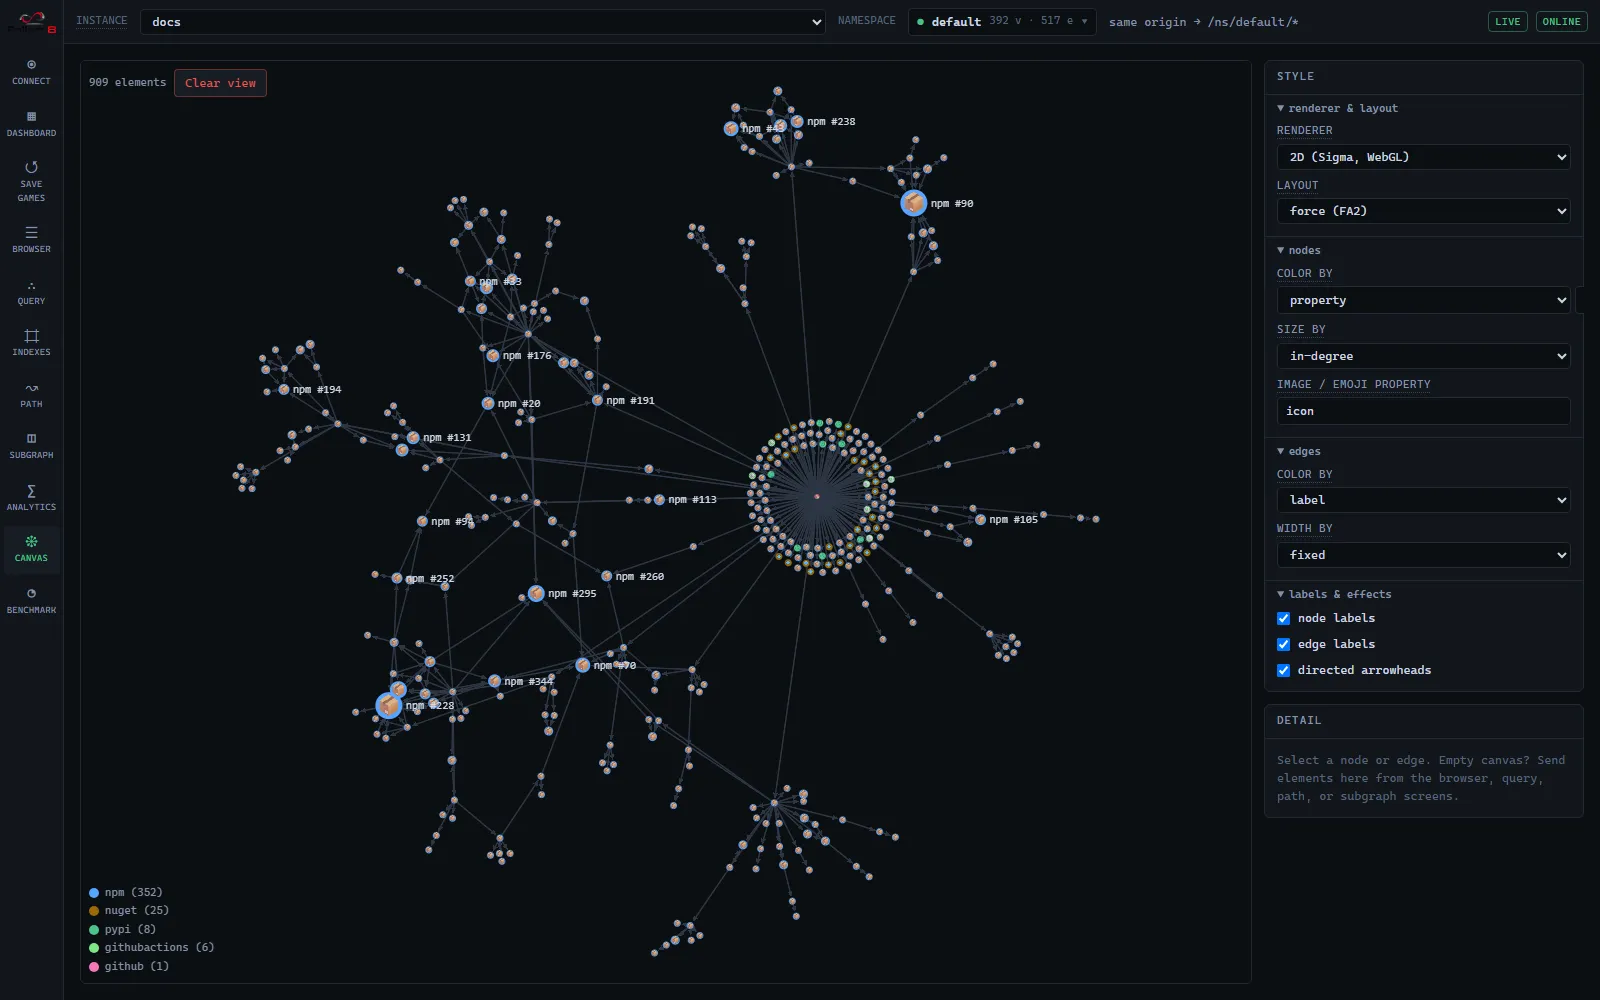
Fallen-8’s own supply chain across every ecosystem (npm, NuGet, PyPI, GitHub Actions), colored by ecosystem and sized by in-degree. The static twin of the live GitHub card.
Try it:
- Analytics →
PAGERANKfor the most-depended-on packages;WCCto see each ecosystem fall out as its own component. - Canvas → color by
licenseorecosystem.
📈 Scale: 100k × 1M and 🐙 Any GitHub repo
Section titled “📈 Scale: 100k × 1M and 🐙 Any GitHub repo”Two more cards round out the gallery:
- Scale: 100k × 1M — a 100,000-vertex, ~1M-edge graph generated server-side on the Benchmark tab (not fetched); use it to feel ingest speed, memory footprint, and analytics at scale. See Studio → Benchmark.
- Any GitHub repo — paste
owner/repoto fetch any public repository’s dependency graph from GitHub just-in-time and ingest it — the dynamic twin of the Fallen-8 Dependencies sample.
Worked examples
Section titled “Worked examples”Semantic search
Section titled “Semantic search”Load Movie Night, open Query, pick the embeddings index, switch to text
(provider), and search a concept rather than keywords. “mind-bending sci-fi about dreams”
ranks Inception top by cosine similarity — the query text is embedded once server-side, then
run as exact kNN.
The mechanics — element embeddings, bound indices, the model-identity contract — are in semantic traversal; the kNN scan itself in vector search.
An interesting path
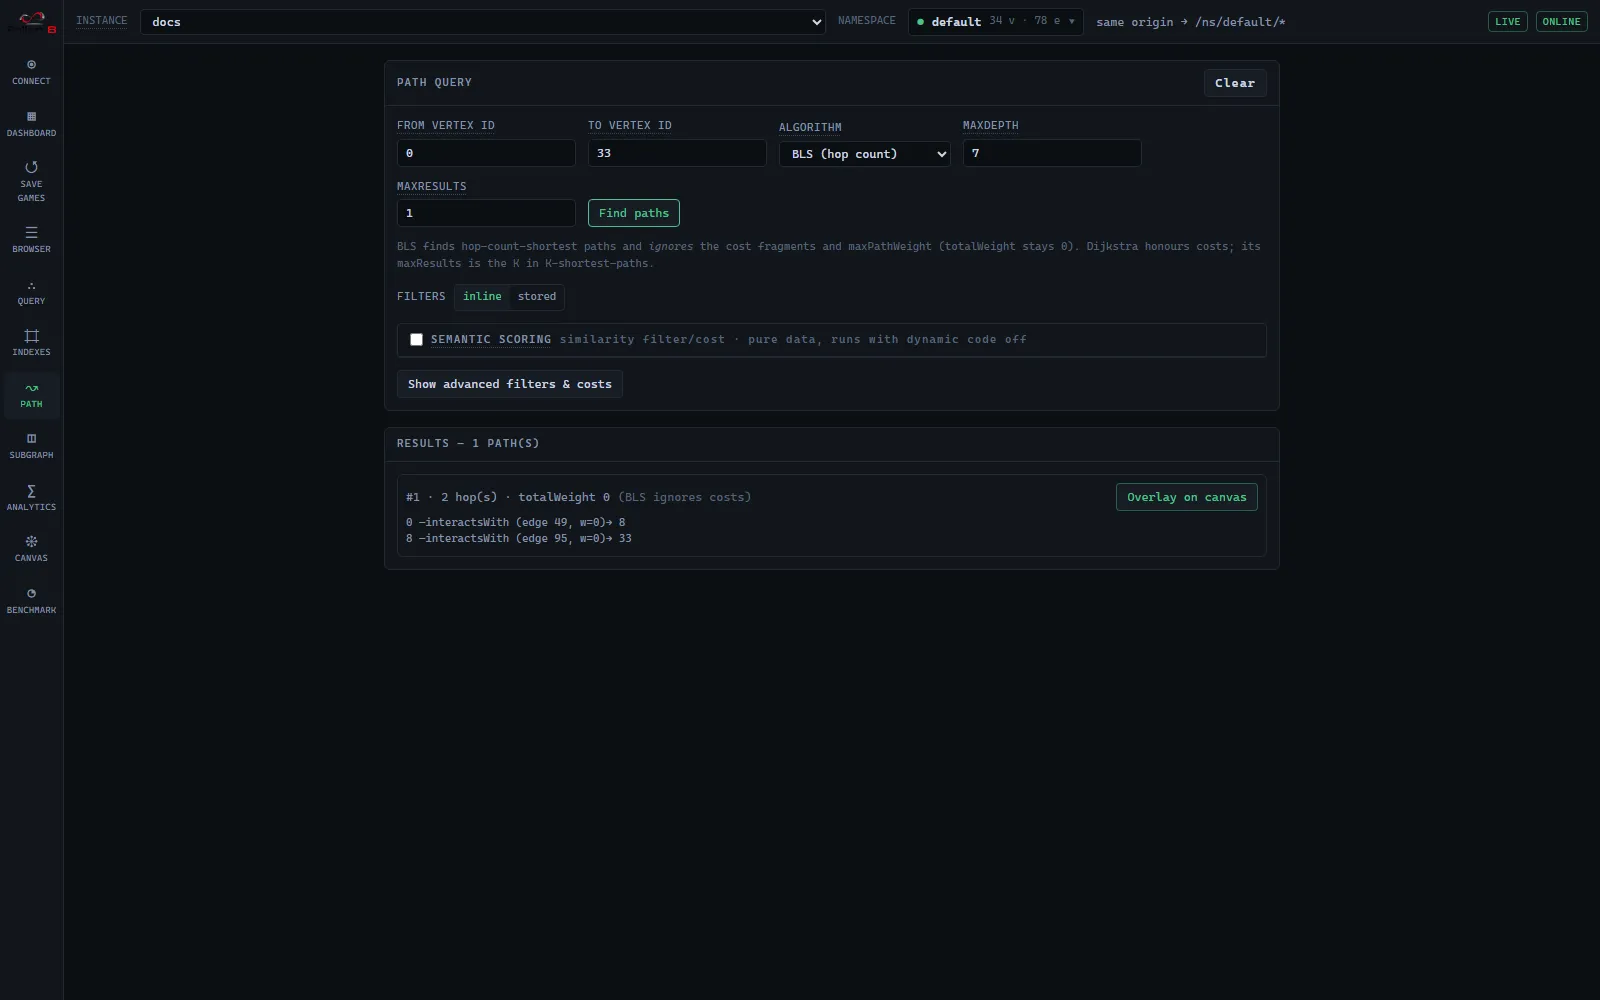
Section titled “An interesting path”The Path screen finds routes between two elements. On a weighted sample (air routes by
km, the attack surface by exploitCost) a Dijkstra run returns the genuinely cheapest
route; the default BLS finds fewest-hop paths.
Filters and cost functions are C# delegates; the full path contract is in path finding.
A subgraph
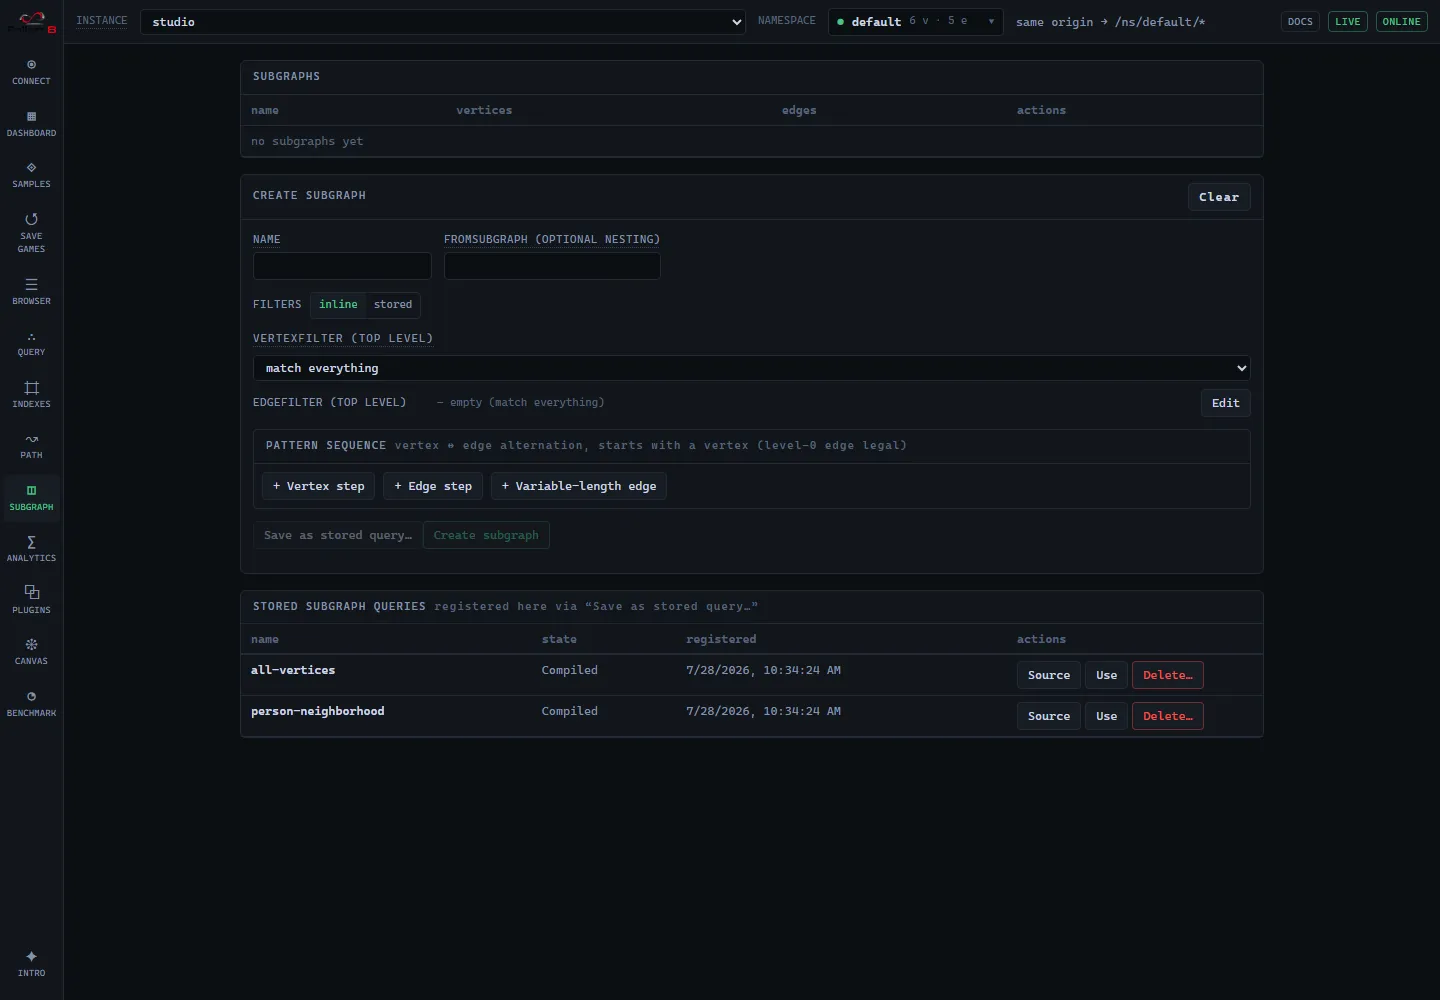
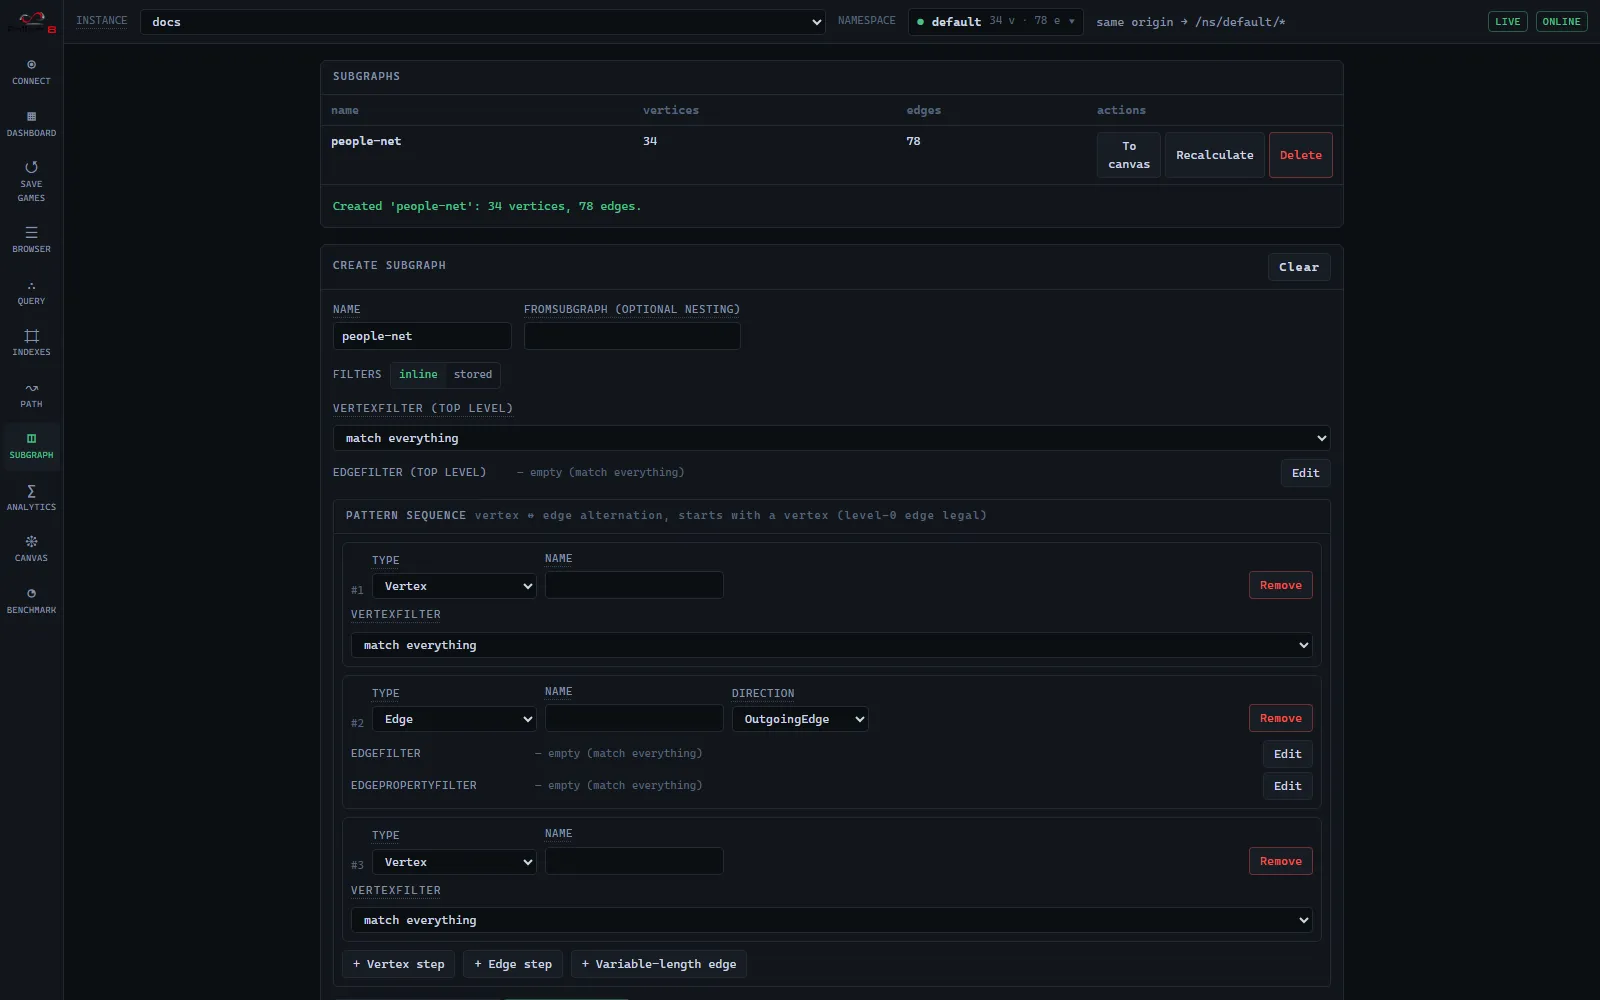
Section titled “A subgraph”The Subgraph screen builds an alternating vertex–edge pattern and extracts everything on a matching path into a new standalone graph.
The pattern model and REST lifecycle are in subgraphs.
Rebuilding and adding samples
Section titled “Rebuilding and adding samples”The datasets live in the repo’s top-level samples/ and are served from a public
raw URL; the gallery is driven entirely by samples/index.json, so adding a sample is a data
change, not a UI change. The embedded samples’ vectors are produced at build time (never at
load) against an instance with the embedding provider on.
See also
Section titled “See also”- Studio — the UI that hosts the gallery
- Bulk import/export — the
fallen8-jsonlformat the samples use - Semantic traversal / Vector search — the embedding features the samples exercise
- Graph analytics · Path finding · Subgraphs — the algorithms the “try it” steps drive